Individual Enrollment Trends and Market Insights
August 20, 2019
In March 2019, health insurers reported total individual, non-group coverage for approximately 15.2 million people, based on statutory financial statements filed with state regulators and the NAIC (National Association of Insurance Commissioners) and the CA DMHC (California Department of Managed Health Care). Additionally, the Centers for Medicare & Medicaid Services (CMS) reported in the Final Open Enrollment Report that approximately 11.4 million consumers enrolled in Marketplace plans following the 2019 open enrollment period (OEP). This includes more than 8.4 million enrolled in the 39 states using the HealthCare.gov platform and 3 million enrolled in the remaining 12 State-Based Marketplaces. These figures indicate 75.4 percent of individual medical members were enrolled through Marketplace plans and 24.6 percent were enrolled in off-exchange plans. In this brief, Mark Farrah Associates (MFA) provides insights into individual health insurance market developments with state-by-state membership comparisons.
Exchange Participation Snapshot
Despite many recent attempts to dissolve the Affordable Care Act (ACA), issuers on the individual market are finally experiencing some stability. According to our industry brief “Profitability Increases for the Individual and Small Group Health Insurance Markets in 2018,” individual segment profitability is at a six-year high. The rise in profits of nearly $1.7 billion in 2017 to over $7.9 billion in 2018 can partly be attributed to premium increases and declining expenses. For 2019, enrollment in the on-exchange market dropped by 300,000 from the previous year to 11.4 million.
In terms of leading competitor exchange participation, UnitedHealth and Anthem considerably downsized their participation in the Marketplace in 2017 and continue to do so. Humana is no longer offering coverage in any state with no announced plans for resuming in 2019 to date. In contrast, some companies are looking to expand their presence in on-exchange plans while states are openly looking for more insurers to enter their markets. Centene continues to grow in membership and recently announced exchange market plans in 10 more states for the upcoming open enrollment period. Colorado recently applied for a waiver to set up a reinsurance program while California enacted an individual mandate with an accompanying subsidy program.
Individual Health Insurance Enrollment
According to financial statements filed by insurers and estimates by Mark Farrah Associates, enrollment in individual, non-group medical plans, both on and off the exchange, totaled approximately 15.2 million as of March 2019. This represents a 3.9 percent decline from the 15.8 million members in March 2018. Although the individual segment experienced an overall decline in enrollment, some providers increased their market presence. Centene enrollment grew by 18.0 percent since March 2018 and remains the lead provider in this segment. Anthem also experienced a positive increase during the same time period but remains in the fourth spot for the second year after scaling back its individual plan offerings in 2017. Guidewell Mutual Holding Group (Florida BCBS) and Kaiser Foundation Group both experienced declines in membership.
Individual Segment - Members |
|||||
Company |
1Q18 |
4Q18 |
1Q19 |
||
|
Centene |
1,684,708 |
1,488,519 |
1,988,638 |
||
|
Guidewell Mutual (BCBS of FL) |
1,301,479 |
1,175,683 |
1,249,945 |
||
|
Kaiser |
1,362,470 |
1,198,032 |
1,195,439 |
||
|
Anthem |
1,047,028 |
954,415 |
1,062,307 |
||
Source: Health Coverage Portal™, Mark Farrah Associates, presenting data from NAIC, CA DMHC
As indicated in the map below, California, Florida, and Texas had the highest number of enrollees, with California covering nearly 2.3 million members as of 1Q19. It is important to note that Mark Farrah Associates (MFA) applied enrollment figures for select carriers not required to report health enrollment on a quarterly basis and made other adjustments based on market analysis. Furthermore, individual enrollment includes short term plan enrollees and may include Medicaid programs, such as CHIP, as some states include subsidized lines in the individual segment. These factors may have resulted in moderate understatement or overstatement of enrollment.
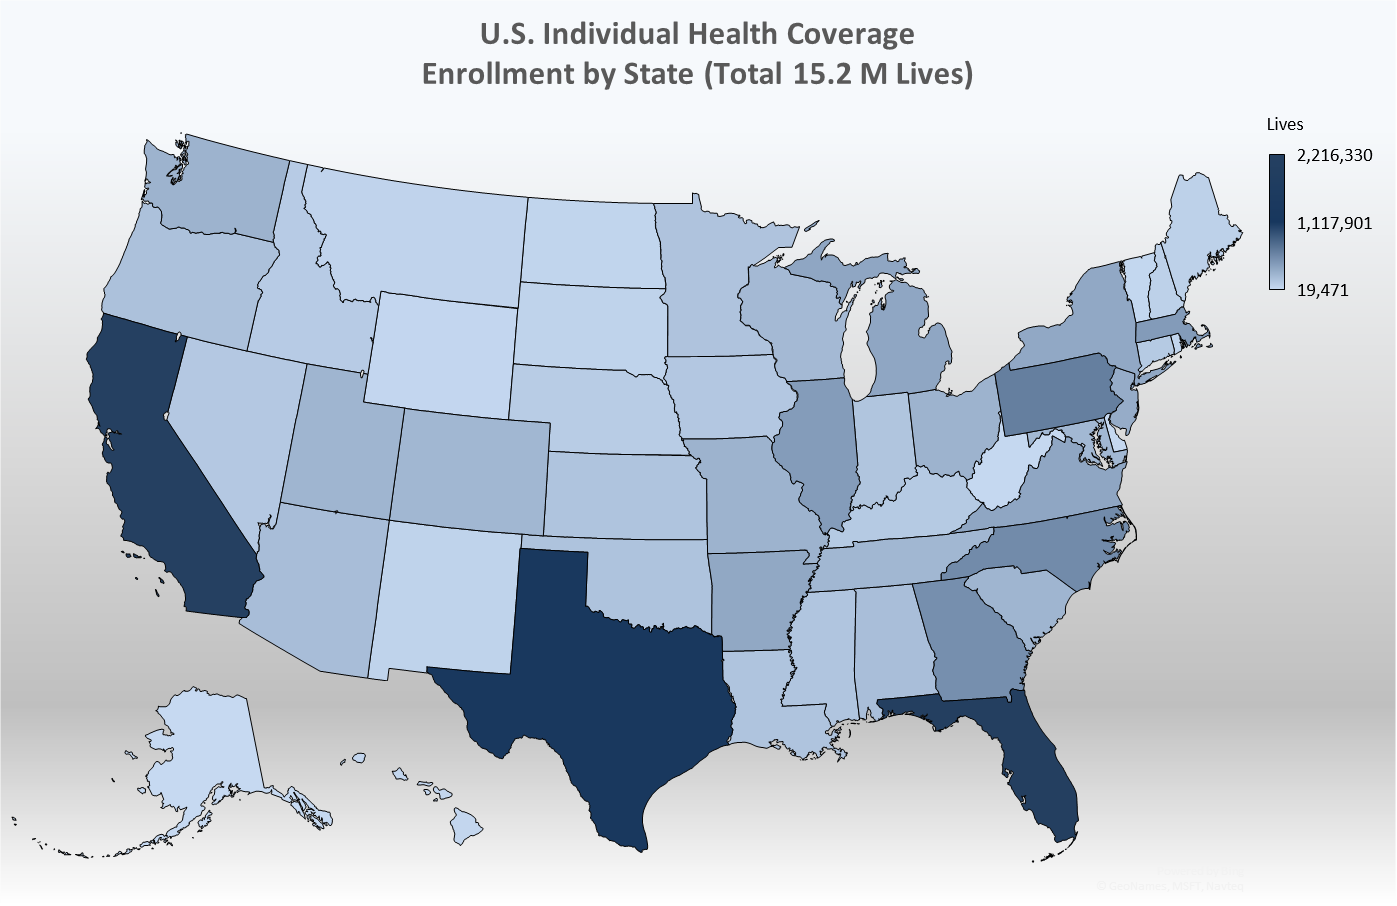
Source: Health Coverage Portal™, Mark Farrah Associates, presenting data from NAIC, CA DMHC and CMS
The following table presents state-by-state breakdowns of the total individual market, separating on and off-exchange membership. For this assessment, MFA applied the assumption that the difference between total individual enrollment reported by carriers and on-exchange, Marketplace enrollment reported in CMS’s Open Enrollment Period (OEP) public use files is a reasonable representation of off-exchange membership. This analysis did not include state-by-state research to provide local market insights about exchange positioning nor did the analysts investigate off-exchange plan options. Nonetheless, the state breakdowns provide a framework for understanding greater market opportunity.
|
State |
March 2018 Total Individual Enrolled |
2018 On-Exchange Enrolled |
Estimated Off-Exchange Enrolled |
|
AK |
19,471 |
17,805 |
1,666 |
| AL |
197,741 |
166,128 |
31,613 |
| AR |
350,273 |
67,413 |
282,860 |
| AZ |
204,316 |
160,456 |
43,860 |
| CA |
2,216,330 |
1,513,883 |
702,447 |
| CO |
246,407 |
170,325 |
76,082 |
| CT |
120,683 |
111,066 |
9,617 |
| DC |
31,053 |
18,035 |
13,018 |
| DE |
24,753 |
22,562 |
2,191 |
| FL |
2,154,578 |
1,783,304 |
371,274 |
| GA |
519,119 |
458,437 |
60,682 |
| HI |
37,599 |
20,193 |
17,406 |
| IA |
136,570 |
49,210 |
87,360 |
| ID |
107,951 |
94,430 |
13,521 |
| IL |
428,069 |
312,280 |
115,789 |
| IN |
155,035 |
148,404 |
6,631 |
| KS |
160,328 |
89,993 |
70,335 |
| KY |
120,884 |
84,620 |
36,264 |
| LA |
158,056 |
92,948 |
65,108 |
| MA |
435,350 |
301,879 |
133,471 |
| MD |
240,144 |
156,963 |
83,181 |
| ME |
73,615 |
70,987 |
2,628 |
| MI |
360,591 |
274,058 |
86,533 |
| MN |
161,943 |
113,552 |
48,391 |
| MO |
273,952 |
220,461 |
53,491 |
| MS |
153,207 |
88,542 |
64,665 |
| MT |
53,865 |
45,374 |
8,491 |
| NC |
544,676 |
501,271 |
43,405 |
| ND |
44,690 |
21,820 |
22,870 |
| NE |
103,104 |
87,416 |
15,688 |
| NH |
71,785 |
44,581 |
27,204 |
| NJ |
319,901 |
255,246 |
64,655 |
| NM |
57,649 |
45,001 |
12,648 |
| NV |
129,577 |
83,449 |
46,128 |
| NY |
348,252 |
271,873 |
76,379 |
| OH |
276,312 |
206,871 |
69,441 |
| OK |
164,060 |
150,759 |
13,301 |
| OR |
178,999 |
148,180 |
30,819 |
| PA |
627,099 |
365,888 |
261,211 |
| RI |
45,501 |
34,533 |
10,968 |
| SC |
263,182 |
214,956 |
48,226 |
| SD |
57,411 |
29,069 |
28,342 |
| TN |
249,380 |
221,533 |
27,847 |
| TX |
1,331,989 |
1,087,240 |
244,749 |
| UT |
259,482 |
194,570 |
64,912 |
| VA |
358,622 |
328,020 |
30,602 |
| VT |
32,310 |
25,223 |
7,087 |
| WA |
275,321 |
220,765 |
54,556 |
| WI |
230,043 |
205,118 |
24,925 |
| WV |
25,162 |
22,599 |
2,563 |
| WY |
33,811 |
24,852 |
8,959 |
| Total |
15,170,201 |
11,444,141 |
3,726,060 |
Source: Health Coverage Portal™, Mark Farrah Associates, presenting data from NAIC, CA DMHC and CMS
Financial Performance
As we reported on July 22, 2019, in our strategy brief titled “Profitability Increases for the Individual and Small Group Health Insurance Markets in 2018”, in 2018 approximately 73 percent of insurers reported a net underwriting gain for the individual segment, up from 50 percent of plans in 2017. Insurers collectively gained over $7.9 billion in the segment last year; a significant turnaround from the $1.7 billion reported in 2017. On an aggregate basis, individual business summed to a net underwriting gain in 43 states. Texas generated the largest total profit, with plans reporting a combined net gain of over $1.1 billion. Florida, Illinois, and North Carolina reported underwriting gains greater than $ 500 million each. Oregon led the country in net underwriting loss, totaling nearly $152 million, followed by California and New York. Take into consideration, these performance indicators include business generated both on and off exchange.
After years of premium growth and a very profitable year for plans in the Individual segment in 2018, plans in the individual segment for 2019 are reporting no growth overall in premiums per member per month (PMPM) along with increased medical expenses PMPM. These two factors have resulted in an increased Medical Expense Ratio in 1Q19, which illustrates the amount of spending on medical costs as a percentage of premiums earned NAIC reporting health companies reported an aggregate medical expense ratio for the individual segment of 72.1 percent in 1Q19, up from 68.0 percent in 1Q18. This stagnation in premium growth could point toward lower levels of profitability for the segment for 2019.
Conclusion
Although the individual segment continues to cause market disruption for carriers, things are currently looking up for this erratic healthcare sector, especially for the on-exchange market. Many insurers are entering or returning to the Marketplace for 2020. As plans race to firm up rates for the 2020 plan year and prepare for open enrollment beginning on November 1st, Mark Farrah Associates will continue to report on important developments and performance metrics for the individual health insurance market.
About Mark Farrah Associates (MFA)
Mark Farrah Associates (MFA) is a leading provider of health plan market data and analysis tools for the healthcare industry. If your company relies on accurate assessments of health plan market share to support business planning, we encourage you to contact us to learn more about our products. Our portfolio includes Health Coverage Portal™, County Health CoverageTM, Medicare Business Online™, Medicare Benefits Analyzer™ and Health Plans USA™ —www.markfarrah.com.
Healthcare Business Strategy is a FREE monthly brief that presents analysis of important issues and developments affecting healthcare business today. If you aren’t on our email distribution list, click here to subscribe now.
Request Information
within 1-2 business days.