Profitability Increases for the Individual and Small Group Health Insurance Markets in 2018
July 22, 2019
Health plans across the country submitted their Supplemental Health Care Exhibits (SHCE) on April 1, 2019, as part of the 2018 National Association of Insurance Commissioners’ (NAIC) Annual Financial Statements. The SHCE contains financial performance metrics, membership, and Preliminary MLR at the state level. Subscribers to Mark Farrah Associates’ (MFAs) Health Coverage Portal or the SHCE & MLR Data have access to this important information. MFA examined some key findings from its latest analysis of the SHCE, including a focus on performance within Individual and Small Group comprehensive insurance segments. Plans in these two segments face the added constraint of a standard (minimum) MLR (Medical Loss Ratio).
Segment Overview
Analysis of segment membership over time allows for a look at the ACA’s impact and course since December 2013. Total enrollment in Individual plans peaked in 2015 with nearly 14.7 million members but has dropped 26% since. Current Individual segment membership stands at approximately 10.9 million members, a gain of 3% since 2013. Membership in small group plans has declined every year since the onset of the ACA with a cumulative drop of 31.7%. Over the same period, the Large Group segment declined 14.2%. Overall, commercial enrollment declined by 15.8% (10.6 million members) to approximately 56.5 million. Meanwhile, Medicaid enrollment surged to approximately 75 million members by the end of 2016 and has since fallen to 73 million in 2018.
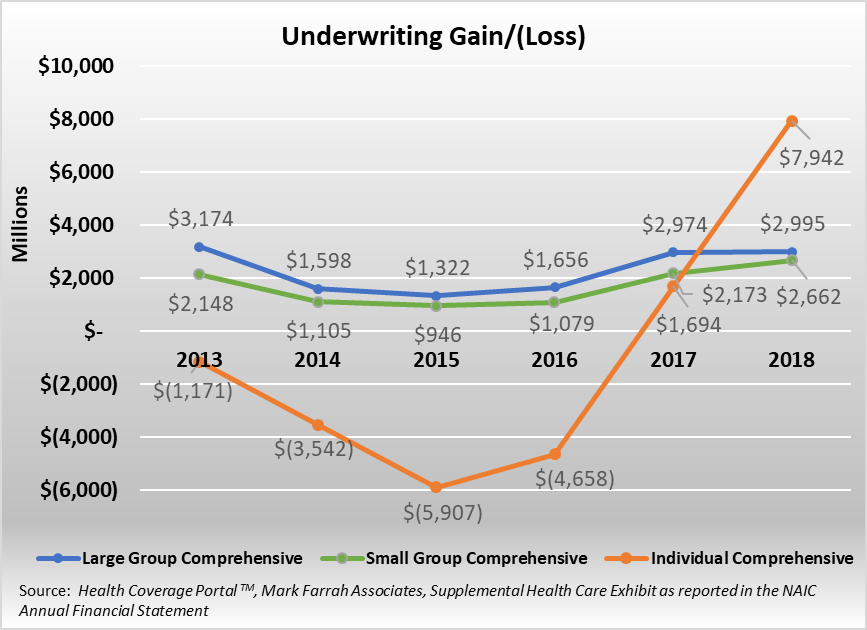
In addition to shifts in membership, segment profitability was greatly impacted between 2013 and 2015 with material declines across the Individual, Small Group, and Large Group segments. After multiple years of premium increases, the industry began to see financial improvement in 2016. Since 2016, all three lines have reported improvements in profitability, with the most dramatic improvement found in the Individual segment. The Large Group segment’s underwriting gain grew from 1.3 billion to almost 3 billion, or 126.5%, since the 2015 low point while enrollment declined by 3.4%. The Small Group segment’s profitability grew 22.5% between 2017 and 2018, even with a 3.0% decline in enrollment. Finally, profitability in the Individual segment jumped in 2018, posting an aggregate underwriting gain of over $7.9 billion, with approximately 73% of plans reporting underwriting gains in 2018. See graph above for more detailed trend information.
2018 saw additional growth in premiums paid by consumers and small and large companies alike. Large Group segment adjusted premium PMPM (per member per month) increased 25.5% since 2013 while claims incurred increased 25.6% during the same period. For 2018, Large Group premium PMPM grew by 4.4%, falling short of the 4.9% growth in medical claims. The Small Group segment saw increases in adjusted premium PMPM of 30.4% between 2013 and 2018, offset by a 29.3% increase in claims incurred over the same time period. For 2018, Small Group premium PMPM grew by 6.2%, outpacing the 5.9% growth in medical claims. The Individual segment experienced the most volatility with premiums since 2013 increasing 118.5% on a PMPM basis. Individual claims incurred rose by over 100.2% on a PMPM basis over the same period. For 2018, premium PMPM grew an additional 21.1% over 2017, outpacing the 9.3% growth in claims incurred.
Individual Comprehensive Segment
As discussed above, the Individual segment has experienced notable financial improvement since 2016. Focusing on the segment leaders for this analysis, we will look at four-year trends in membership, claims incurred PMPM, adjusted premium PMPM, and their SHCE-reported MLR.
| Company | 2015 | 2016 | 2017 | 2018 |
|---|---|---|---|---|
| Centene | 144,674 | 426,049 | 852,961 | 1,246,117 |
| GuideWell | 574,848 | 749,036 | 988,211 | 1,175,758 |
| HCSC | 1,625,406 | 1,162,797 | 915,598 | 850,546 |
| Anthem | 1,121,322 | 1,092,008 | 1,183,616 | 561,201 |
| Kaiser | 256,962 | 350,210 | 390,961 | 486,026 |
Source: Health Coverage Portal TM, Mark Farrah Associates, Supplemental Health Care Exhibit as reported in the NAIC Annual Financial Statement
Segment leadership is based on 2018 SHCE-reported membership by company. Noteworthy for 2018, Molina, which had joined the top 5 plans in the segment in 2017 fell back in 2018 due to its decision to leave Utah and Wisconsin’s Individual marketplace. Molina’s exit has cleared a path for Kaiser which has grown its membership in the Individual segment. Among the segment leaders, only Health Care Service Corporation (HCSC) and Kaiser reported membership growth in 2018. From 2017 to 2018, the entire Individual segment lost almost 1.2 million members.
| Company | 2015 | 2016 | 2017 | 2018 |
|---|---|---|---|---|
| Centene | $184 | $288 | $256 | $251 |
| GuideWell | $379 | $343 | $403 | $422 |
| HCSC | $381 | $341 | $398 | $438 |
| Anthem | $280 | $345 | $382 | $417 |
| Kaiser | $311 | $305 | $324 | $367 |
Source: Health Coverage Portal TM, Mark Farrah Associates, Supplemental Health Care Exhibit as reported in the NAIC Annual Financial Statement
Increases in medical costs have continued to occur within the Individual segment. Average incurred claims PMPM increased from $197 in 2013 to $395 in 2018, a 100.2% increase. Overall, the segment saw a 9.3% growth in claims PMPM in 2018. Kaiser experienced the largest increase, growing to $367 PMPM in 2018 from $324 PMPM in 2017, or 13.4%. Centene was the only leading plan seeing a decline in claims PMPM, dropping 1.9% to $251 PMPM.
| Company | 2015 | 2016 | 2017 | 2018 |
|---|---|---|---|---|
| Centene | $245 | $252 | $324 | $341 |
| GuideWell | $420 | $412 | $474 | $541 |
| HCSC | $327 | $336 | $483 | $645 |
| Anthem | $304 | $374 | $436 | $556 |
| Kaiser | $255 | $251 | $297 | $384 |
Source: Health Coverage Portal TM, Mark Farrah Associates, Supplemental Health Care Exhibit as reported in the NAIC Annual Financial Statement
Increasing medical costs have led to large premium increases within the segment. Since 2013, adjusted premium PMPM increased approximately 118.5%. Growth in premium PMPM has been significant in both 2017 and 2018. Large increases in premiums have outpaced the growth in claims cost, improving financial performance within the segment. For 2018, Centene reported a 5.1% increase in premium PMPM, the smallest increase of the top 5 plans. HCSC’s premium PMPM increased 33.6% since 2017, the largest increase amongst the segment leaders.
| Company | 2015 | 2016 | 2017 | 2018 |
|---|---|---|---|---|
| Centene | 74.5% | 110.0% | 80.0% | 75.0% |
| GuideWell | 82.6% | 80.1% | 85.3% | 78.7% |
| HCSC | 103.7% | 95.2% | 82.4% | 68.5% |
| Anthem | 86.3% | 88.3% | 88.3% | 76.1% |
| Kaiser | 114.5% | 117.8% | 110.0% | 96.7% |
Source: Health Coverage Portal TM, Mark Farrah Associates, Supplemental Health Care Exhibit as reported in the NAIC Annual Financial Statement
The Medical Loss Ratio (MLR) illustrates the relationship between premiums and medical costs. With improving profitability, many plans have experienced decreases in their MLRs. For the segment leaders, all five companies reported lower MLRs in 2018. Of the leading plans, Kaiser, with the highest MLR of 96.7%, was the only company reporting a segment underwriting loss.
It is important to note that Mark Farrah Associates is reporting all data as filed with the NAIC (National Association of Insurance Commissioners) in the annual SHCE. We are not adjusting the data to account for differences in the number of reporting plans between 2013 and 2018 nor have we adjusted for any missing plans year over year. For purposes of this analysis, MFA has calculated a weighted average MLR based upon adjusted premiums. Additionally, Mark Farrah analysts chose to use the NAIC Statement of Revenue and Expenses financial reporting for Centene’s Celtic Insurance Company over the NAIC SHCE to avoid distortion in premium dollars caused by an intercompany-ceded reinsurance agreement with Health Net Life.
Small Group Comprehensive Segment
While the Small Group segment has not experienced the same volatility in premiums and claims as the Individual segment, it has lost considerable membership (31.7%) since 2013 with small businesses opting to either self-insure or drop health insurance coverage for their employees. Focusing on the segment leaders for this analysis, we will look at four-year trends in membership, claims incurred PMPM, adjusted premium PMPM and segment leaders’ SHCE-reported MLR.
| Company | 2015 | 2016 | 2017 | 2018 |
|---|---|---|---|---|
| UnitedHealth | 2,175,155 | 2,454,888 | 2,304,117 | 2,497,280 |
| HCSC | 1,230,805 | 1,122,545 | 1,113,402 | 1,168,945 |
| Anthem | 1,060,130 | 916,943 | 864,220 | 763,153 |
| Humana | 979,171 | 802,477 | 745,120 | 604,300 |
| CVS/Aetna | 1,084,762 | 788,671 | 493,040 | 324,195 |
Source: Health Coverage Portal TM, Mark Farrah Associates, Supplemental Health Care Exhibit as reported in the NAIC Annual Financial Statement
The five segment leaders, based on membership, include UnitedHealth, HCSC, Anthem, Humana, and CVS/Aetna. While United and HCSC saw increases in 2018, the rest of the segment leaders experienced further losses in membership. Their membership dropped an additional 2.9% in 2018 and is down almost 1.2 million members since 2015. Membership in the Small Group segment is down 5.3 million since 2013.
Please note that due to inconsistent reporting, Mark Farrah analysts estimated CVS/Aetna’s Small Group segment membership for 2018.
| Company | 2015 | 2016 | 2017 | 2018 |
|---|---|---|---|---|
| UnitedHealth | $339 | $356 | $380 | $399 |
| HCSC | $351 | $372 | $380 | $407 |
| Anthem | $299 | $337 | $359 | $392 |
| Humana | $207 | $197 | $224 | $248 |
| CVS/Aetna | $287 | $332 | $363 | $347 |
Source: Health Coverage Portal TM, Mark Farrah Associates, Supplemental Health Care Exhibit as reported in the NAIC Annual Financial Statement
While costs have risen within the segment, growth in claims incurred has been more manageable compared with the Individual segment. Average incurred claims PMPM have increased from $292 in 2013 to $377 in 2018, a 29.3% increase. Overall, the segment saw a 5.9% growth in claims PMPM in 2018, similar to 2017. UnitedHealth reported below average growth in its claims PMPM of 4.9%. Humana experienced an 11.1% jump and CVS/Aetna reported a 4.5% decrease. HCSC was also ahead of the segment average, reporting a 7.1% increase in claims PMPM, its largest increase since 2016.
| Company | 2015 | 2016 | 2017 | 2018 |
|---|---|---|---|---|
| UnitedHealth | $414 | $431 | $464 | $486 |
| HCSC | $396 | $425 | $467 | $501 |
| Anthem | $363 | $407 | $435 | $480 |
| Humana | $247 | $239 | $279 | $303 |
| CVS/Aetna | $326 | $375 | $443 | $446 |
Source: Health Coverage Portal TM, Mark Farrah Associates, Supplemental Health Care Exhibit as reported in the NAIC Annual Financial Statement
Average adjusted premium PMPM for the segment rose from $349 in 2013 to $455 in 2018, a 30.4% increase. All segment leaders have raised their premiums to offset medical cost increases. CVS/Aetna’s adjusted premium PMPM has increased 36.8% since 2015. Anthem saw a 32.3% increase in its adjusted premium PMPM over the last four years, including an over 10% increase from 2017 to 2018. Humana still reports the lowest premiums PMPM among the segment leaders.
| Company | 2015 | 2016 | 2017 | 2018 |
|---|---|---|---|---|
| UnitedHealth | 82.8% | 83.5% | 83.0% | 82.9% |
| HCSC | 89.1% | 87.8% | 81.9% | 82.1% |
| Anthem | 83.4% | 83.9% | 83.7% | 83.0% |
| Humana | 85.7% | 84.6% | 82.2% | 83.8% |
| CVS/Aetna | 89.1% | 89.1% | 82.9% | 77.7% |
Source: Health Coverage Portal TM, Mark Farrah Associates, Supplemental Health Care Exhibit as reported in the NAIC Annual Financial Statement
Overall, the leading plans have been able to better manage MLRs within the Small Group segment as compared to larger challenges in the Individual Segment. Since 2015, Aetna’s 36.8% increase in premium PMPM was able to more than offset its 20.6% increase in incurred claims PMPM, resulting in an 11.4% point drop in its weighted average MLR. Similarly, HCSC’s adjusted premium PMPM grew by 26.6% while claims PMPM grew by 16.2%, leading to a 7.0% point drop in its weighted average MLR.
Conclusion
The Large Group segment showed modest growth profitability in 2018, while the Small Group segment’s premium growth continued to outpace medical spending, further building upon the improved profitability found in 2017. For the Individual segment, 2018 appears to be a record setting year for profitability with a $7.9 billion underwriting gain, larger than those of both the Large and Small Group segments combined. In 2017, 50% of individual plans were still reporting losses; for 2018, only 27% report underwriting losses. In many cases, growth in premiums has outpaced that of medical costs; for some leading plans, premium dollars have significantly outpaced medical spending, leading to concerns about the overall affordability of health insurance. Proper balancing of premium increases and cost control will be needed to maintain profitability for the insurance companies and affordability for the consumer. Mark Farrah Associates will continue to analyze and report on important ACA and plan performance related topics. Please stay tuned for future analysis briefs with valuable insights about the health care industry.
SCHE Data
The data used in this analysis brief was obtained from Mark Farrah Associates' Health Coverage Portal TM using Supplemental Health Care Exhibit (SHCE) data as reported in the NAIC Annual Financial Statement. Each year, MFA updates its products with the latest SHCE data. Additionally, MFA maintains financial data as well as enrollment and market share for the health insurance industry in the subscription-based Health Coverage Portal TM.
For more information about our products, refer to the product videos and brochures available on Mark Farrah Associate’s website or call 724-338-4100.
About Mark Farrah Associates (MFA)
Mark Farrah Associates (MFA) is a leading provider of health plan market data and analysis tools for the healthcare industry. If your company relies on accurate assessments of health plan market share to support business planning, we encourage you to contact us to learn more about our products. Our portfolio includes Health Coverage Portal™, County Health Coverage TM, Medicare Business Online™, Medicare Benefits Analyzer™ and Health Plans USA™ - - www.markfarrah.com.
Healthcare Business Strategy is a FREE monthly brief that presents analysis of important issues and developments affecting healthcare business today. If you would like to be added to our email distribution list, please submit your email to the "Subscribe to MFA Briefs" section at the bottom of this page.
Glossary
Weighted Average MLR – For analysis purposes, Mark Farrah Associates calculated average Preliminary MLR weighted on the adjusted premiums for each company by segment. The MLRs used in the calculation are average ratios based upon 2015 – 2018 as reported in the NAIC’s Supplemental Health Care Exhibit.