Improved Profitability for the Individual and Small Group Health Insurance Markets
June 25, 2018
On April 1, 2018, health plans across the country submitted their Supplemental Health Care Exhibits (SHCE) as part of the 2017 National Association of Insurance Commissioners’ (NAIC) Annual Financial Statements. The SHCE contains financial performance metrics, membership, and Preliminary MLR at the state level. Subscribers to Mark Farrah Associates’ (MFAs) Health Coverage Portal or the SHCE & MLR Data have access to this important information. MFA examined some key findings from its latest analysis of the SHCE, including a focus on performance within Individual and Small Group comprehensive insurance segments. Plans in these two segments face the added constraint of a standard (minimum) MLR (Medical Loss Ratio).
Segment Overview
The analysis of segment membership changes over time allow for a look at the ACA’s impact and direction since December 2013. Total enrollment in Individual plans increased 39% between 2013 and 2015 but has dropped 17.8% since. Current Individual segment membership stands at 12.1 million members, a gain of 14.3% over 2013. Membership in small group plans has declined every year since the onset of ACA with a cumulative drop of 30%. While the Large Group segment stopped its decline in 2017, growing almost 2% over 2016, the segment overall is down 11.3% since 2013. Overall, commercial enrollment declined by 11.8% (7.94 million members) to approximately 59 million. Meanwhile, Medicaid enrollment has surged to approximately 74.4 million members, a 26.5% gain since before the onset of the ACA. In addition to shifts in membership, segment profitability has also been impacted with material declines across Individual, Small Group and Large Group comprehensive lines between 2013 and 2015. After multiple years of premium increases, the industry began to see improvement in 2016 which has continued for 2017.
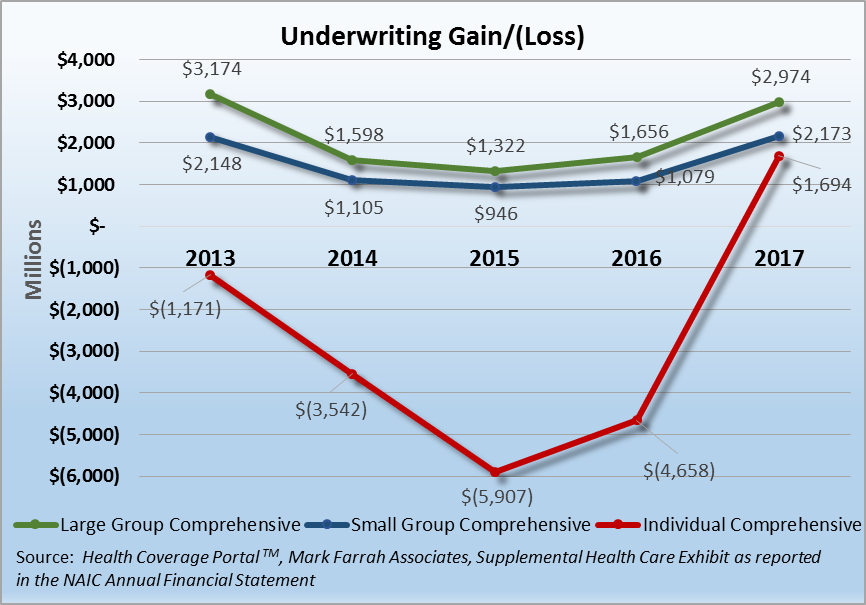
2015 marked the low point for profitability in the commercial segments. Since 2015, all three lines have reported improvements in profitability, with the most dramatic improvement found in the Individual segment. The Large Group segment’s underwriting gain grew from 1.6 billion to almost 3 billion, or 80%, between 2016 and 2017 while only increasing enrollment by 2%. Not to be outdone, the Small Group segment’s profitability more than doubled since 2016 and is now higher than the pre-ACA mark of $2.148 billion, even with the 30% decline in enrollment. Finally, the Individual segment experienced the most dramatic turn around, posting an aggregate underwriting gain of $1.7 billion, the first reported gain since segment reporting began in 2010.
Once again, 2017 saw additional growth in premiums paid by consumers and small and large companies alike. While premium growth outpaced the growth in claims incurred for the Large Group and Individual segments in 2016, growth in premiums outpaced claims in all three commercial segments in 2017. Large Group segment adjusted premium PMPM (per member per month) increased 19.9% since 2013 while claims incurred increased by nearly 19.6% during the same period. For 2017, Large Group premium PMPM grew by 4%, outpacing the 2.4% growth in medical claims. Similarly, the Small Group segment saw increases in adjusted premium PMPM of 23.4%, offset by a 22.7% increase in claims incurred since 2013. For 2017, Small Group premium PMPM grew by 9%, outpacing the 6% growth in medical claims. The Individual segment experienced the most volatility with premiums since 2013 increasing 80.7% on a PMPM basis. Individual claims incurred rose by over 83.5% on a PMPM basis over the same period. For 2017, premium PMPM grew an additional 18.9% over 2016, outpacing the 3.7% growth in claims incurred.
Individual Comprehensive Segment
As discussed above, the Individual segment saw significant financial improvement in 2017. In fact approximately 50% of the companies in the segment posted gains in 2017 vs. 30% in 2016. Focusing on the segment leaders for this analysis, we will look at four-year trends in membership, claims incurred PMPM, adjusted premium PMPM, and their SHCE-reported MLR.
|
Individual Segment-Members |
||||
| Company | 2014 | 2015 | 2016 | 2017 |
| Anthem | 1,231,263 | 1,121,322 | 1,092,208 | 1,183,616 |
| GuideWell | 595,684 | 574,848 | 749,036 | 988,211 |
| HCSC | 1,566,609 | 1,625,406 | 1,162,797 | 915,598 |
| Centene | 74,774 | 144,674 | 425,478 | 852,961 |
| Molina | 8,316 | 188,321 | 458,713 | 678,207 |
Source: Health Coverage Portal™, Mark Farrah Associates, Supplemental Health Care Exhibit as reported in the NAIC Annual Financial Statement |
||||
Segment leadership is based on 2017 SHCE-reported membership by company. Of significant note for 2017, UnitedHealth and Aetna, traditionally among the segment leaders, have fallen out of the top 5 plans due to their decisions to leave many state exchanges/marketplaces. Their exit has cleared a path for Centene and Molina who have been aggressively gaining membership in the Individual segment. Anthem, GuideWell Mutual Holding Group (Florida BCBS), Health Care Service Corporation (HCSC), Centene and Molina collectively gained over .7 million members in 2017 while the rest of the segment lost almost 2.7 million members. Centene and GuideWell experienced the largest growth in membership, while HCSC contracted during the period.
| Individual Segment-Incurred Claims PMPM | ||||
| Company | 2014 | 2015 | 2016 | 2017 |
| Anthem | $251 | $280 | $345 | $382 |
| GuideWell | $334 | $379 | $343 | $403 |
| HCSC | $314 | $381 | $341 | $398 |
| Centene | $236 | $184 | $288 | $256 |
| Molina | $451 | $211 | $221 | $254 |
Source: Health Coverage Portal™, Mark Farrah Associates, Supplemental Health Care Exhibit as reported in the NAIC Annual Financial Statement |
||||
Increases in medical costs have continued to occur within the Individual segment. In fact, this was conducive to leading companies leaving Marketplaces in several states. Average incurred claims PMPM increased from $197 in 2013 to $362 in 2017, an 83.5% increase. While growth in claims costs surged in 2014 and 2015, growth has averaged a little over 4% in 2016 and 2017. While the segment saw a 3.7% growth in claims PMPM in 2017, 4 out of the 5 top companies saw PMPM costs increase by over 10%. GuideWell experienced the largest increase, growing to $403 PMPM from $343 PMPM, or 17.3%. Centene was the only leading plan seeing a decline in claims PMPM, dropping 11.4% to $256 PMPM.
| Individual Segment-Adjusted Earned Premium PMPM | ||||
| Company | 2014 | 2015 | 2016 | 2017 |
| Anthem | $283 | $304 | $374 | $436 |
| GuideWell | $341 | $420 | $412 | $474 |
| HCSC | $271 | $327 | $336 | $483 |
| Centene | $308 | $245 | $252 | $324 |
| Molina | $441 | $254 | $238 | $286 |
Source: Health Coverage Portal™, Mark Farrah Associates, Supplemental Health Care Exhibit as reported in the NAIC Annual Financial Statement |
||||
Increasing medical costs have led to large premium increases within the segment. Since 2013, adjusted premium PMPM increased approximately 81%. Unlike the slowing growth in claims PMPM, growth in premium PMPM has been significant in both 2016 and 2017. Large increases in premiums have outpaced claims cost increases, improving financial performance within the segment. For 2017, GuideWell reported a 15.1% increase in premium PMPM, the smallest increase of the top 5 plans. HCSC’s premium PMPM increased 43.6% since 2016 and 78.4% since 2013, the largest increase amongst the segment leaders.
| Individual Segment Weighted Average MLR | ||||
| Company | 2014 | 2015 | 2016 | 2017 |
| Anthem | 89.9% | 86.3% | 88.3% | 88.3% |
| BuideWell | 98.6% | 82.6% | 80.1% | 85.3% |
| HCSC | 117.9% | 103.7% | 95.2% | 82.4% |
| Centene | 77.4% | 74.5% | 110.0% | 80.0% |
| Molina | 104.5% | 79.4% | 91.5% | 90.6% |
Source: Health Coverage Portal™, Mark Farrah Associates, Supplemental Health Care Exhibit as reported in the NAIC Annual Financial Statement |
||||
The Medical Loss Ratio (MLR) illustrates the relationship between premiums and medical costs. With improving profitability, many plans have experienced decreases in their MLRs. For the segment leaders, only GuideWell increased between 2016 and 2017, although they still reported an underwriting gain in the segment. Of the leading plans, Molina, with the highest MLR of 90.6%, was the only company reporting a segment loss amongst the top 5.
It is important to note that Mark Farrah Associates is reporting all data as filed with the NAIC (National Association of Insurance Commissioners) in the annual SHCE. We are not adjusting the data to account for differences in the number of reporting plans between 2013 and 2016 nor have we adjusted for any missing plans year over year. For purposes of this analysis, MFA has calculated a weighted average MLR based upon adjusted premiums.
Small Group Comprehensive Segment
While the Small Group segment has not experienced the same volatility in premiums and claims as the Individual segment, it has lost considerable membership (30%) since 2013 with small businesses opting to either self-insure or to drop health insurance coverage for their employees. Focusing on the segment leaders for this analysis, we will look at the four-year trends in membership, claims incurred PMPM, adjusted premium PMPM and their SHCE-reported MLR.
| Small Group Segment-Members | ||||
| Company | 2014 | 2015 | 2016 | 2017 |
| UnitedHealth | 2,211,481 | 2,175,155 | 2,454,888 | 2,304,117 |
| HCSC | 1,270,155 | 1,230,085 | 1,122,545 | 1,113,402 |
| Anthem | 1,277,821 | 1,060,130 | 916,943 | 864,220 |
| Humana | 930,414 | 979,171 | 802,477 | 745,120 |
| Aetna | 1,333,474 | 1,084,762 | 788,611 | 493,040 |
Source: Health Coverage Portal™, Mark Farrah Associates, Supplemental Health Care Exhibit as reported in the NAIC Annual Financial Statement |
||||
The five segment leaders, based on membership, include UnitedHealth, HCSC, Anthem, Humana and Aetna. All of the top 5 companies have experienced further losses in membership in 2017. Their membership dropped an additional 9.2% in 2017 and is down over 1.5 million members since 2014. Aetna experienced the greatest loss of members in 2017, losing 63% of their small group membership. Membership in the Small Group segment is down 4.9 million since 2013.
| Small Group Segment-Incurred Claims PMPM | ||||
| Company | 2014 | 2015 | 2016 | 2017 |
| UnitedHealth | $329 | $339 | $356 | $380 |
| HCSC | $323 | $351 | $372 | $380 |
| Anthem | $295 | $299 | $337 | $359 |
| Humana | $202 | $207 | $197 | $224 |
| Aetna | $257 | $287 | $332 | $363 |
Source: Health Coverage Portal™, Mark Farrah Associates, Supplemental Health Care Exhibit as reported in the NAIC Annual Financial Statement |
||||
While costs have risen within the segment, growth in claims incurred has been more manageable as compared with the Individual segment. Average incurred claims PMPM have increased from $292 in 2013 to $358 in 2017, a 22.7% increase. Overall, the segment saw a 6% growth in claims PMPM in 2017. While UnitedHealth and Anthem experienced growth in their claims PMPM of 6.7% and 6.5% respectively, Humana experienced a 13.5% jump and Aetna reported a 9.5% increase. HCSC fared better in 2017, reporting a 2.4% increase in claims PMPM, their smallest increase since 2014.
| Small Group Segment-Adjusted Earned Premium PMPM | ||||
| Company | 2014 | 2015 | 2016 | 2017 |
| UnitedHealth | $394 | $414 | $431 | $464 |
| HCSC | $376 | $396 | $425 | $467 |
| Anthem | $355 | $363 | $407 | $435 |
| Humana | $249 | $247 | $239 | $279 |
| Aetna | $298 | $326 | $375 | $443 |
Source: Health Coverage Portal™, Mark Farrah Associates, Supplemental Health Care Exhibit as reported in the NAIC Annual Financial Statement |
||||
Average adjusted premium PMPM for the segment rose from $349 in 2013 to $431 in 2017, a 23.4% increase. All segment leaders have raised their premiums to offset medical cost increases. Aetna’s adjusted premium PMPM increased 48.6% since the 2014 period. HCSC saw a 24.1% increase in its adjusted premium PMPM. Humana, facing less claims cost pressure in this segment, only increased premium PMPM by 12% between 2014 and 2017; however, 2017 saw a large increase of 16.7% after two years of declining premium PMPM.
| Small Group Segment weighted Average MLR | ||||
| Company | 2014 | 2015 | 2016 | 2017 |
| UnitedHealth | 84.6% | 82.7% | 83.5% | 83.0% |
| HCSC | 86.3% | 89.1% | 87.8% | 81.9% |
| Anthem | 84.1% | 83.4% | 83.9% | 83.7% |
| Humana | 83.5% | 85.7% | 84.6% | 82.2% |
| Aetna | 87.2% | 89.1% | 89.1% | 82.9% |
Source: Health Coverage Portal™, Mark Farrah Associates, Supplemental Health Care Exhibit as reported in the NAIC Annual Financial Statement |
||||
Overall, the leading plans have been able to better manage MLRs within the Small Group segment as compared to larger challenges in the Individual Segment. Since 2014, Aetna’s 48.6% increase in premium PMPM was able to more than offset its 41.5% increase in incurred claims PMPM, resulting in a 6.2% point drop in its weighted average MLR. Similarly, HCSC’s adjusted premium PMPM grew by 24.1% while claims PMPM grew by 17.8%, leading to a 6% point drop in its weighted average MLR.
Conclusion
Within the Commercial Segments, 2017 was a much improved year for health insurance plans. Significant improvement in segment profitability should have a stabilizing effect on the industry. However, with 50% of individual plans still reporting losses, not all plans have experienced improvement. This, coupled with further declines in membership for the Individual and Small Group segments, will force further change in the industry. In many cases, premiums have caught up with medical costs, leading to concerns about the overall affordability of health insurance. Proper balancing of premium increases and cost control will be needed to maintain profitability for the insurance companies and affordability to the consumer. Mark Farrah Associates will continue to analyze and report on important ACA and plan performance related topics. Please stay tuned for future analysis briefs with valuable insights about the health care industry.
SCHE Data
The data used in this analysis brief was obtained from Mark Farrah Associates' Health Coverage Portal TM using Supplemental Health Care Exhibit (SHCE) data as reported in the NAIC Annual Financial Statement. Each year, MFA updates its products with the latest SHCE data. Additionally, MFA maintains financial data as well as enrollment and market share for the health insurance industry in the subscription-based Health Coverage Portal TM.
For more information about our products, refer to the product videos and brochures available on Mark Farrah Associate’s website or call 724-338-4100.
About Mark Farrah Associates (MFA)
Mark Farrah Associates (MFA) is a leading provider of health plan market data and analysis tools for the healthcare industry. If your company relies on accurate assessments of health plan market share to support business planning, we encourage you to contact us to learn more about our products. Our portfolio includes Health Coverage Portal™, County Health Coverage TM, Medicare Business Online™, Medicare Benefits Analyzer™ and Health Plans USA™ - - www.markfarrah.com.
Healthcare Business Strategy is a free monthly brief that presents analysis of important issues and developments affecting healthcare business today. If you would like to be added to our email distribution list, please submit your email to the "Subscribe to MFA Briefs" section in the grey area at the bottom of the page.
Glossary
Weighted Average MLR – For analysis purposes, Mark Farrah Associates calculated average Preliminary MLR weighted on the adjusted premiums for each company by segment. The MLRs used in the calculation are average ratios based upon 2014 – 2017as reported in the NAIC’s Supplemental Health Care Exhibit.