A Brief Analysis of the Individual Health Insurance Market
August 6, 2018
In March 2018, health insurers reported total individual, non-group coverage for approximately 15.75 million people, based on statutory financial statements filed with state regulators and the NAIC (National Association of Insurance Commissioners) and the CA DMHC (California Department of Managed Health Care). Additionally, the Centers for Medicare & Medicaid Services (CMS) reported in the Final Open Enrollment Report that approximately 11.8 million consumers enrolled in Marketplace plans following the 2018 open enrollment period (OEP). This includes more than 8.7 million enrolled in the 39 states using the HealthCare.gov platform and 3 million enrolled in the remaining 12 State-Based Marketplaces. These figures indicate 75% of individual medical members were enrolled through Marketplace plans and 25% were enrolled in off-exchange plans, including short term and grandfathered plans; currently an estimated 4 million. In this brief, Mark Farrah Associates (MFA) provides insights into individual health insurance market developments with state-by-state membership comparisons.
Exchange Participation Snapshot
Now well into its fifth year of implementation, the Affordable Care Act (ACA) and endless policy changes continue to shake-up the healthcare industry. Unsustainability, due to increased medical claims and premiums, adverse selection and immature risk pools, has resulted in several health insurer exits from the exchanges. Insurer participation is essential for health insurance market stability and competition, yet, according to CMS, only 132 issuers are currently selling exchange plans. This is in stark contrast to the 252 issuers offering individual on-exchange coverage across all states and the District of Columbia in 2015. Additionally, eight states currently offer coverage through only one or two carriers and over half of all U.S. counties have just one insurer offering Marketplace plans.
In terms of leading competitor exchange participation, UnitedHealth considerably downsized its participation in the Marketplace and withdrew nearly all of its exchange business in 2017. Aetna and Humana soon followed suit by no longer offering coverage in any state for 2018. Anthem significantly retreated from Obamacare and exited five states, while Cigna reduced its participation to just six states for 2018. Several Blue Cross Blue Shield plans and regional competitors also either scaled back or exited the market. However, many insurers stuck with the program and others even extended their coverage. Centene, now offers on-exchange plans in 15 states and Oscar Health, which entered the exchanges in New York in 2014, extended its presence in New Jersey, Ohio, Texas, California and Tennessee for 2018.
Despite recent attacks on the ACA by the Trump administration, there have been signs indicating the market has stabilized, slightly. Some leading insurers reported experiencing more favorable financial results for their exchange business in 2018 and are considering expansion plans for 2019. Furthermore, there have been no mentions of exits thus far, and a projected 13 states could potentially see expansion for next year. Anthem, for example, plans to offer policies in an additional 17 counties in Kentucky and may expand into Maine. A few others that are planning to expand or enter new exchange markets in 2019 include Centene, Molina, Bright Health, Oscar Health, Wellmark and Medica. Notwithstanding, while things appear to be looking up for the on-exchange individual market, insurer expansion intentions could certainly change with further adjustments to the law from the Trump administration.
Individual Health Insurance Enrollment
According to financial statements filed by insurers and estimates by Mark Farrah Associates, enrollment in individual, non-group medical plans, both on and off the exchange, totaled approximately 15.7 million as of March 2018. This represents an 11.1% decline from the 17.7 million members in March 2017. Centene has moved into the lead in this segment, surpassing Anthem which has dropped to the fourth spot after scaling back their individual plan offerings. Kaiser Foundation Group and Guidewell Mutual Holding Group (the parent company of Blue Cross Blue Shield affiliates operating in Florida), both experienced significant gains in membership.
Individual Segment - Members |
|||||
Company |
1Q17 |
4Q17 |
1Q18 |
||
|
Centene |
1,309,621 |
1,075,655 |
1,684,709 |
||
|
Kasier |
1,175,817 |
1,044,166 |
1,364,124 |
||
|
Guidewell Mutual |
1,171,146 |
988,130 |
1,301,479 |
||
|
Anthem |
2,215,041 |
1,876,684 |
1,046,793 |
||
Source: Health Coverage Portal™, Mark Farrah Associates, presenting data from NAIC, CA DMHC
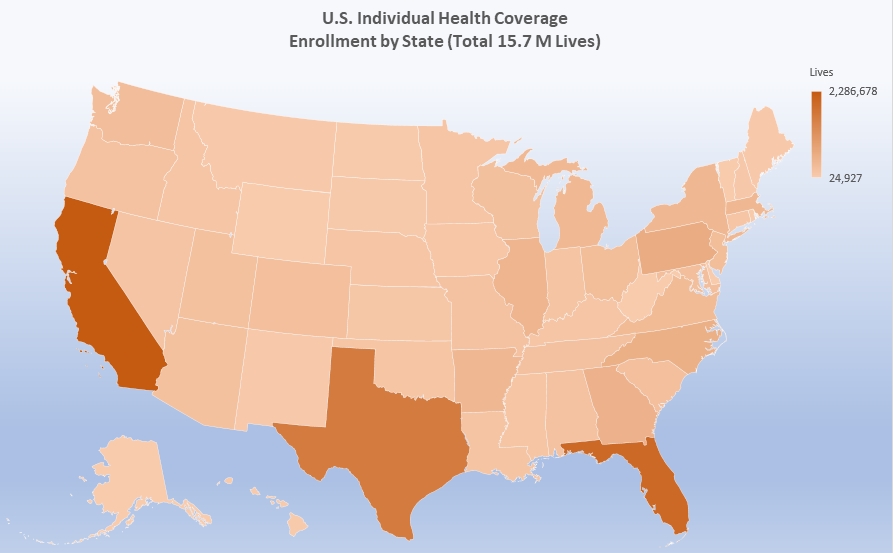
As indicated in the map below, California, Florida and Texas had the highest number of beneficiaries, with California covering nearly 2.3 million members as of 1Q18. It is important to note that Mark Farrah Associates (MFA) applied enrollment figures for select carriers not required to report health enrollment on a quarterly basis and made other adjustments based on market analysis. Furthermore, individual enrollment includes short term plan enrollees and may include Medicaid programs, such as SCHIP, as some states include subsidized lines in the individual segment. These factors may have resulted in moderate understatement or overstatement of enrollment.
Source: Health Coverage Portal™, Mark Farrah Associates, presenting data from NAIC, CA DMHC
The following table presents state-by-state breakdowns of the total individual market, separating on and off-exchange membership. For this assessment, MFA applied the assumption that the difference between total individual enrollment reported by carriers and on-exchange, Marketplace enrollment reported in CMS’s Open Enrollment Period (OEP) public use files is a reasonable representation of off-exchange membership. This analysis did not include state-by-state research to provide local market insights about exchange positioning nor did the analysts investigate off-exchange plan options. Nonetheless, the state breakdowns provide a framework for understanding greater market opportunity.
|
State |
March 2018 Total Individual Enrolled |
2018 On-Exchange Enrolled |
Estimated Off-Exchange Enrolled |
|
AK |
24,927 |
18,313 |
6,614 |
| AL |
207,492 |
170,211 |
37,281 |
| AR |
420,834 |
68,100 |
352,734 |
| AZ |
223,691 |
165,758 |
57,933 |
| CA |
2,286,678 |
1,521,524 |
765,154 |
| CO |
266,158 |
161,764 |
104,394 |
| CT |
136,329 |
114,134 |
22,195 |
| DC |
28,697 |
19,289 |
9,408 |
| DE |
27,483 |
24,500 |
2,983 |
| FL |
1,977,844 |
1,715,227 |
262,617 |
| GA |
516,089 |
480,912 |
35,177 |
| HI |
40,630 |
19,799 |
20,831 |
| IA |
128,939 |
53,217 |
75,722 |
| ID |
138,913 |
94,507 |
44,406 |
| IL |
462,438 |
334,979 |
127,459 |
| IN |
171,160 |
166,711 |
4,449 |
| KS |
114,350 |
98,238 |
16,112 |
| KY |
144,242 |
89,569 |
54,673 |
| LA |
170,848 |
109,855 |
60,993 |
| MA |
415,214 |
267,260 |
147,954 |
| MD |
283,990 |
153,584 |
130,406 |
| ME |
72,762 |
75,809 |
-3,047 |
| MI |
386,718 |
293,940 |
92,778 |
| MN |
140,656 |
116,358 |
24,298 |
| MO |
195,761 |
243,382 |
-47,621 |
| MS |
151,364 |
83,649 |
67,715 |
| MT |
71,494 |
47,699 |
23,795 |
| NC |
572,190 |
519,803 |
52,387 |
| ND |
52,284 |
22,486 |
29,798 |
| NE |
141,593 |
88,213 |
53,380 |
| NH |
97,318 |
49,573 |
47,745 |
| NJ |
312,118 |
274,782 |
37,336 |
| NM |
63,676 |
49,792 |
13,884 |
| NV |
160,794 |
91,003 |
69,791 |
| NY |
407,296 |
253,102 |
154,194 |
| OH |
312,074 |
230,127 |
81,947 |
| OK |
148,826 |
140,184 |
8,642 |
| OR |
207,179 |
156,105 |
51,074 |
| PA |
646,953 |
389,081 |
257,872 |
| RI |
44,860 |
33,021 |
11,839 |
| SC |
256,723 |
215,983 |
40,740 |
| SD |
58,854 |
29,652 |
29,202 |
| TN |
231,852 |
228,646 |
3,206 |
| TX |
1,618,331 |
1,126,838 |
491,493 |
| UT |
223,865 |
194,118 |
29,747 |
| VA |
354,865 |
400,015 |
-45,150 |
| VT |
30,972 |
28,763 |
2,209 |
| WA |
303,792 |
243,227 |
60,565 |
| WI |
238,641 |
225,435 |
13,206 |
| WV |
30,477 |
27,409 |
3,068 |
| WY |
33,463 |
24,529 |
8,934 |
| Total |
15,754,697 |
11,750,175 |
4,004,522 |
Source: Health Coverage Portal™, Mark Farrah Associates, presenting data from NAIC, CA DMHC and CMS
Financial Performance
As we reported on June 25, 2018 in our strategy brief titled “ Improved Profitability for the Individual and Small Group Health Insurance Markets ”, in 2017 approximately 50% of insurers reported a net underwriting gain for the individual segment, up from only 20% of plans in 2016. Insurers collectively gained almost $1.7 billion in the segment last year; a significant turnaround from the $4.7 billion loss reported in 2016. On an aggregate basis, individual business summed to a net underwriting gain in 32 states. The state of North Carolina generated the largest total profit, with plans reporting a combined net gain of $512 million. Pennsylvania, Florida, & Illinois, reported underwriting gains greater than $ 200 million each. Virginia led the country in net underwriting loss, totaling approximately $158 million, followed closely by New York and Maryland. Bear in mind, these performance indicators include business generated both on and off exchange.
So far in 2018, based upon NAIC reporting from health companies, plans in the individual segment are showing improved profitability over that seen in 2017. Premiums PMPM have increased, outpacing the increase in medical costs and leading to a further decline in the medical expense ratio which illustrates the amount of spending on medical costs as a percentage of premiums earned. In 1Q18, the aggregate medical expense ratio for the individual segment stands at 68%, down from 75.2% in 1Q17.
Conclusion
Although the individual segment continues to cause market disruption for carriers, things may be looking up for this erratic healthcare sector, especially for the on-exchange market. In contrast to the highly unsettled landscape just a year ago, many insurers are entering or returning to the Marketplace for 2019. As plans race to firm up rates for the 2019 plan year and prepare for open enrollment beginning on November 1 st , Mark Farrah Associates will continue to report on important developments and performance metrics for the individual health insurance market.
About Mark Farrah Associates (MFA)
Mark Farrah Associates (MFA) is a leading provider of health plan market data and analysis tools for the healthcare industry. If your company relies on accurate assessments of health plan market share to support business planning, we encourage you to contact us to learn more about our products. Our portfolio includes Health Coverage Portal™, County Health Coverage TM , Medicare Business Online™, Medicare Benefits Analyzer™ and Health Plans USA™ — www.markfarrah.com .
Healthcare Business Strategy is a free monthly brief that presents analysis of important issues and developments affecting healthcare business today. If you would like to be added to our email distribution list, please submit your email to the "Subscribe to MFA Briefs" section in the grey area at the bottom of the page.