Year-Over-Year Enrollment Trends for Third Quarter 2018 Health Insurance Business
February 7, 2019
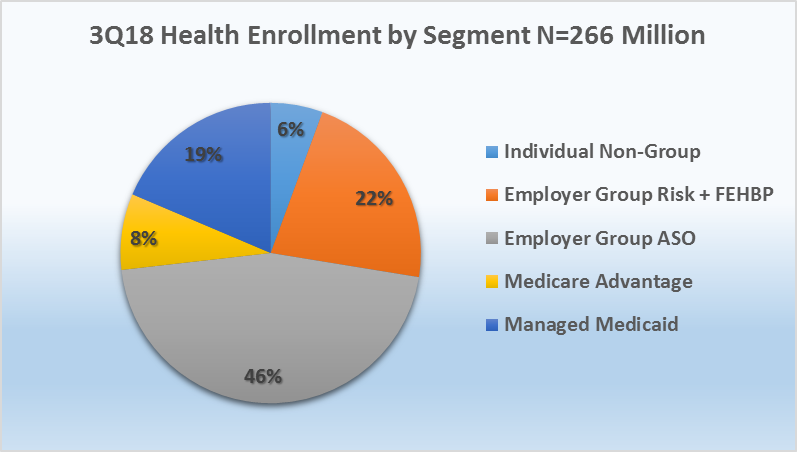
Year-over-year third quarter enrollment trends indicate continued membership gains for Medicare Advantage (MA), Managed Medicaid and Group ASO, while individual market and Employer-Group risk business have experienced declines over the past year. Based on data filed in statutory financial reports from the National Association of Insurance Commissioners (NAIC) and the California Department of Managed Health Care (CA DMHC), Mark Farrah Associates (MFA) analyzed the latest year-over-year enrollment trends, comparing third quarter 2017 with third quarter 2018 segment membership. As of September 30, 2018, 266.4 million people received medical coverage from U.S. health insurers. This number is up from 263.7 million, or approximately 2.7 million members, from a year ago.
Segment by Segment Enrollment Trends
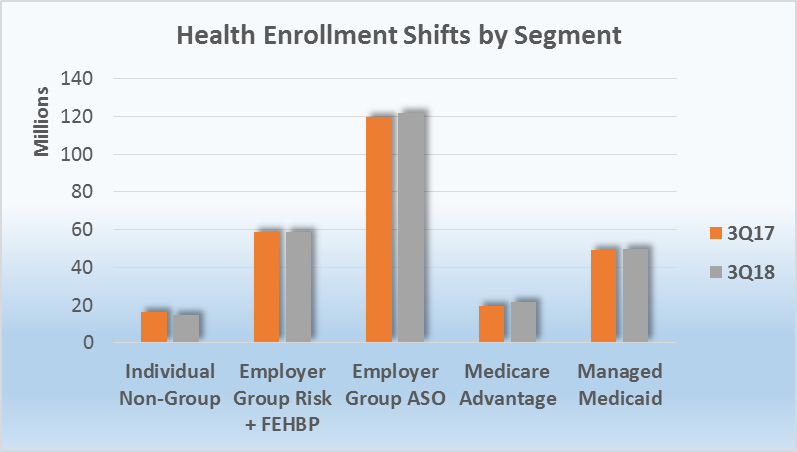
As of September 30, 2018, 2.4 million more seniors chose a Medicare Advantage (MA) plan. Managed Medicaid saw a slight increase of approximately 160,000 members, year-over-year. In contrast to these enrollment increases, on-and off-exchange individual business lost approximately 1.4 million members, and the Employer-Group risk segment, including Federal Employees Health Benefit Plans (FEHBP) business, experienced a decline of over 435,500 members. The Employer-Group ASO segment gained nearly 2 million members since the same period last year, with total enrollment reaching 121.5 million people as of the third quarter of 2018.
Source: Health Coverage Portal TM, Mark Farrah Associates
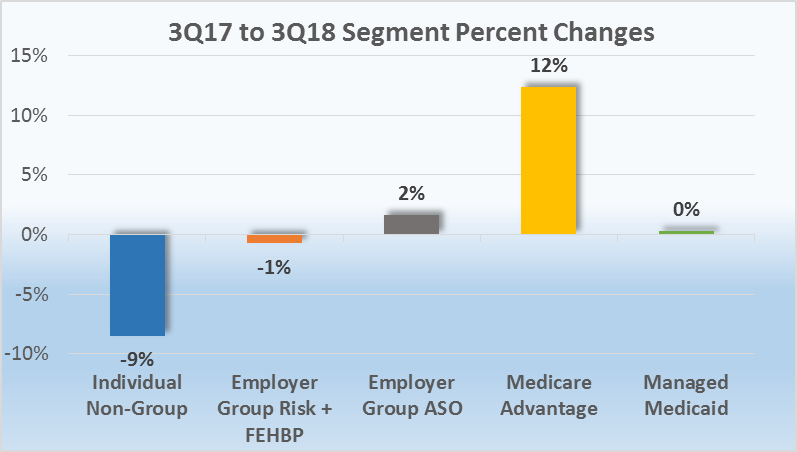
- The individual market continued to experience year-over-year enrollment declines. Membership for this segment decreased 9%, from 16.3 million enrollees in 3Q17 to 14.9 million in 3Q18, marking a low point in individual membership since the implementation of the Affordable Care Act (ACA) in 2014.
- Between September 30, 2017 and September 30, 2018, Managed Medicaid membership slightly increased by approximately 160,000 members (a fraction of 1%). According to data filed in statutory financial reports, 49.5 million Medicaid beneficiaries received healthcare through Managed Care Organizations (MCOs) in third quarter 2018. It’s important to note that some plans submit special performance reports to the state and are not required to file statutory financial statements.
- Medicare Advantage membership continued to experience significant increases as year-over-year trends have shown steady growth for nearly a decade. The Medicare Advantage market continues to attract more and more health plans as MA business provides insurers an opportunity for growth. According to plan-reported statutory reports, enrollment in MA plans increased from 19.4 million in 3Q17 to 21.8 million in 3Q18. This is an increase of 12% and a trend that is predicted to continue as more baby boomers enter retirement.
Source: Health Coverage Portal TM, Mark Farrah Associates
- Employer-Groups continue to be the leading source of health coverage in the U.S. Employer-Group risk membership, including Federal Employees Health Benefit Plans (FEHBP) enrollment, decreased by roughly 400,000 beneficiaries between 3Q17 and 3Q18, from 58.9 million to 58.5 million. This decrease can be attributed to more employers continuing to shift towards self-funded (ASO) insurance to reduce costs.
- According to MFA’s most recent estimates, Employer Group ASO (administrative services only for self-funded business) identified 121.5 million ASO covered lives, which comprised 46% of total health enrollment by segment for 3Q18.Membership grew by 1.97 million members. This accounts for a 2% increase from September 2017 to September 2018.
Source: Health Coverage Portal TM, Mark Farrah Associates
About the Data
The data used in this analysis brief was obtained from Mark Farrah Associates' Health Coverage Portal™ database. It is important to note that MFA estimated third quarter 2018 enrollment for a small number of health plans that are required to report quarterly enrollment but hadn’t yet filed. Employer Group ASO figures may be estimated by Mark Farrah Associates using credible company and industry resources. Individual, Non-Group membership reported by some carriers may include CHIP (Children’s Health Insurance Program).
These adjustments may have resulted in moderate understatement or overstatement of enrollment changes by segment. Findings reflect enrollment reported by carriers with business in the U.S. and U.S. territories. Data sources include National Association of Insurance Commissioners (NAIC) and the California Department of Managed Health Care (CA DMHC). As always, MFA will continue to report on important plan performance and competitive shifts across all segments.
About Mark Farrah Associates (MFA)
Mark Farrah Associates (MFA) is a leading data aggregator and publisher providing health plan market data and analysis tools for the healthcare industry. Our product portfolio includes Health Coverage Portal™, County Health Coverage™, Medicare Business Online™, Medicare Benefits Analyzer™, and Health Plans USA™. For more information about these products, refer to the informational videos and brochures available under the Our Products section of the website or call 724-338-4100.
Healthcare Business Strategy is a FREE monthly brief that presents analysis of important issues and developments affecting healthcare business today. If you would like to be added to our email distribution list, please submit your email address to the "Subscribe to MFA Briefs" section at the bottom of this page.