Second Quarter Health Insurance Profitability Trends
October 16, 2025,
In this brief, Mark Farrah Associates (MFA) compared second quarter, year-over-year (YOY) profitability for the Individual, Employer-Group, Medicare Advantage, and managed Medicaid health insurance segments. Financial insights were gleaned from aggregated 2Q24 and 2Q25 statutory financial data from MFA’s Health Coverage Portal™.
Individual Segment Performance
According to financial statements filed by health insurers to the National Association of Insurance Commissioners (NAIC) and estimated by Mark Farrah Associates, enrollment in individual medical plans totaled approximately 26.4 million, as of June 2025, as compared to 25 million a year ago. This is a gain of over 1.3 million members.
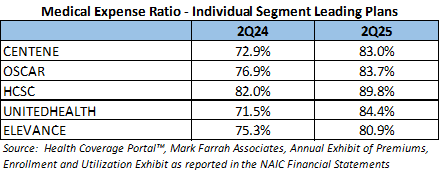
For the second quarter of 2025, premiums earned increased 13.1% while health care services (medical expenses) incurred grew 21.9% from second quarter 2024. On a PMPM (per member per month) basis, which accounts for changes in membership and reporting plans, premiums increased 3.0%, while medical expenses increased by 11.1%. Through the first two quarters of 2025, the average medical expense ratio for the individual segment was 86.7%, as compared to 80.4% the previous year.

Notable change came to the Individual segment with CVS and Guidwell dropping out of the top plans replaced by Oscar and Elevance. All of the segment leaders reported financial results showing an increased medical expense ratio at the end of 2Q25, as compared to 2Q24. With premium growth being outpaced by medical expenses, UnitedHealth reported the largest increase in its medical expense ratio, increasing to 84.4% from 71.5% in 2Q24. Elevance reported a 11.3% increase in medical spending on a PMPM basis, which was partially offset by a 3.7% increase in premiums PMPM, leading to the smallest reported increase in the average medical expense ratio and the lowest ratio amongst the leading plans.
Employer-Group Segment Performance
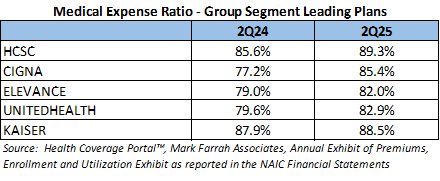
Health insurance companies in the Employer-Group risk segment reported 42.2 million members, as of June 30, 2025, down 3.2% from June 30, 2024. For health insurers, profitability has decreased. For the second quarter of 2025, premiums earned increased 11.8% and medical expenses increased 14.9% from second quarter of 2024. This is mostly due to a large Cigna plan reporting quarterly data for the first time in 2025. After adjusting for this change, premiums are up 1.8% and medical expenses increased 4.7% over 2024. On a PMPM basis, premiums earned have increased 4.8% over 2Q24, while medical expenses grew by 7.6%. Growth in premium was outpaced by the increase in medical expenses, moving the average medical expense ratio for this segment up to 86.6% for 2Q25, from 84.3% in 2Q24.

All the top five plans in the segment are reporting higher ratios so far for 2025. Cigna’s results are impacted by the significant change in reporting over 2024. HCSC, Elevance & UnitedHealth all reported an approximate 4% increase in their medical expense ratios on the back of increased medical spending. Kaiser reported an 8.2% increase in Premiums PMPM which was close to the 8.9% increase in Medical Expenses PMPM leading to a small .64% increase in their medical expense ratio.
Medicare Advantage Performance
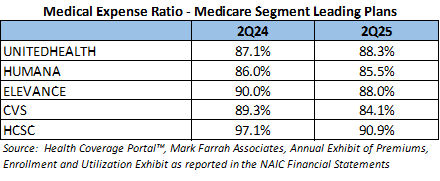
Medicare Advantage (MA) segment growth is continuing, but at a slower rate compared with previous years. According to CMS Medicare Advantage enrollment reports aggregated by MFA in Medicare Business Online™, total Medicare Advantage plan enrollment was approximately 35.4 million: a growth of almost 1.2 million members since June 2024. 2024 was a miserable year financially for most insurers in the segment. In fact, 2024 was the first year the segment reported a combined underwriting loss since MFA began reporting on Medicare in 2006. Unfortunately for health plans, 2025 has not shown any improvement. YOY second quarter profitability for this segment has decreased, although slightly. For second quarter of 2025, premiums earned increased 15.2% while medical expenses increased 15.3% from the second quarter of 2024. On a PMPM basis, premiums earned have increased 10.2% over 2Q24, while medical expenses grew by 10.4%. The growth in medical expenses, which was greater than the increase in premiums expenses, pushed the average medical expense ratio for this segment up to 88.5% for 2Q25, from 88.3% in 2Q24.

Turning our attention to the segment leaders, 4 of the 5 plans reported financial results indicating a decrease in their medical expense ratios. For CVS, a 15.1% increase in premiums on a PMPM basis helped to lower the ratio to 84.1%, the lowest in the group of leaders. HCSC joined the top 5 this year with their acquisition of Cigna’s Medicare business. UnitedHealth reported the only increase in their Medicare Expense ratio due to a 13% increase in medical expenses that was only partially offset by an 11.5% increase in premiums all on a PMPM basis. UnitedHealth reported a $5.6 billion gain in the Medicare segment in 2024, dwarfing Humana’s $600 million which was the only other plan in the top 5 to report an underwriting gain in the segment for 2024.
Managed Medicaid Performance
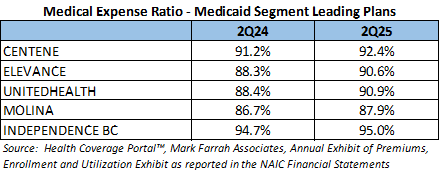
Centers for Medicare & Medicaid Services (CMS) reported Medicaid and CHIP membership of almost 77.8 million for June 2025, down from 80 million members in June 2024. For year-to-date second quarter 2025, premiums earned increased 8.6% while medical expenses incurred increased 10.9% from second quarter 2024. On a PMPM basis, premiums earned increased 11.2% over 2Q24, while medical expenses increased 13.6%. The increase in premiums PMPM fell behind the increase in medical expenses PMPM, pushing the medical expense ratio up to 92.1% in 2Q25.

All five segment leaders reported financial results leading to a medical expense ratio increases over 2Q24. UnitedHealth experienced the largest change in their medical expense ratio, growing from 88.4% in 2Q24 to 90.9% in 2Q25. This growth was due to increases in medical expenses that were not offset by premium growth on a PMPM basis. Independence Blue Cross continued to report a higher-than-average medical expense ratio at 95%, up from 94.7% in 2Q24, the lowest increase among the segment leaders.
Conclusion
On a consolidated level for second quarter 2025, health plans are reporting an 88.7% medical expense ratio, which is up from 87.8% at the end of June 2024. Rising medical expense ratios will negatively impact payer profitability and therefore it is no surprise that the increase is a driving factor in the reported 43% decrease in underwriting gains through June 2025 vs 2024. Mark Farrah Associates will continue to analyze and report on important health insurance segment performance and related topics. Stay tuned for future analysis briefs with valuable insights about the health care industry.
About Our Analysis
Medical expense ratio is calculated by dividing health care costs/claims incurred by premiums earned. This ratio indicates the amount of premium dollars spent on medical expenses. The higher the ratio, the less room there is for the plan to pay for its administrative costs, potentially impacting profitability. Per member per month (PMPM) calculations are also used to determine the amount of premium dollars earned and the amount of medical costs incurred for each member on a monthly basis. These calculations are performed by dividing premiums or medical claims incurred by the number of reported member months for the plan.
Data for this analysis was sourced from Mark Farrah Associates’ Health Coverage Portal™, Quarterly Exhibit of Premiums, Enrollment & Utilization (EPEU) as reported in the NAIC Financial Statements and the NAIC Statement of Revenue and Expenses. Approximately 80% of the health insurance market is represented within the exhibit. Managed Medicaid plans & California HMO plans that do not report to the NAIC, along with NAIC-reporting Life, Accident & Health, and Property & Fraternal Insurance plans do not file the exhibit. To improve the accuracy of our assessment, premiums earned, and member month data was estimated based upon the NAIC Statement of Revenue and Expenses due to incomplete or erroneous EPEU reporting by a small number of plans.
About Mark Farrah Associates (MFA)
Mark Farrah Associates (MFA) is a leading data aggregator and publisher providing health plan market data and analysis tools for the healthcare industry. Our product portfolio includes Health Coverage Portal™, County Health Coverage™, 5500 Employer Health plus, Medicare Business Online™, Medicare Benefits Analyzer™, and Health Plans USA™. For more information about these products, refer to the informational videos and brochures available under the Our Products section of the website or call 724-338-4100.
Healthcare Business Strategy is a FREE brief that presents analysis of important issues and developments affecting healthcare business today. If you would like to be added to our email distribution list, please submit your email to the "Subscribe to MFA Briefs" section at the bottom of this page.