Medicare Advantage Plans Cover Over 21 Million Seniors as of February 2018
March 19, 2018
Despite an era of uncertainty in the U.S. healthcare industry, Medicare Advantage (MA) continues to experience enrollment gains. MA plans remain appealing to the senior population as these plans often provide extra benefits and services at lower costs over original Medicare. The large number of Baby Boomers entering retirement each day is rapidly rising and insurers have become more and more dependent on Medicare Advantage business for increases in enrollment, revenue and profits. As of February 1, 2018, total Medicare Advantage membership stood at 21,079,661 with a net gain of 1,486,320 members, year-over-year. This brief assesses Medicare Advantage plan performance, analyzes market share for individually purchased and employer-sponsored benefits and evaluates MA plan type preferences as of February 1, 2018.
Competitive Dynamics
Although Medicare Advantage market penetration remains strong, there is still abundant opportunity for growth in this highly competitive segment with only 34% of the 61 million people eligible for Medicare opting to choose a Medicare Advantage plan. The Annual Election Period (AEP) for Medicare Advantage and prescription drug plans runs from October 15 th through December 7 th each year. During the AEP, companies compete by offering new pricing and product options to beneficiaries. Health plans then begin to analyze final enrollment results in February and March to evaluate their standing and assess which competitors gained and lost members during the last AEP. Many companies conduct their post-AEP competitive assessments by using tools such as Mark Farrah Associates’ (MFA) Medicare Business Online™ and Health Coverage Portal™.
According to CMS Medicare Advantage enrollment reports aggregated by MFA in Medicare Business Online™, total Medicare Advantage (MA) plan enrollment as of February 1, 2018 increased 7.6% from February 2017. The top ten companies, each with more than 250,000 members, have a sizeable stake in this segment and they collectively provide coverage for 70% of the market. Per the reference tables below, most leading MA companies realized year-over-year growth except for Cigna and Highmark. The overall net gain for the ten companies was nearly 10 percent.
UnitedHealth continues to be the leading Medicare Advantage organization in the country. With 5.25 million enrolled, UnitedHealth commands approximately 25% of the market. Humana ranks second with 16.8% market share and over 3.54 million lives. Aetna maintains the third position on the leader board, enrolling approximately 1.75 million and Kaiser Foundation Group closely follows with over 1.57 million lives.
| February 2018 Top MA Organizations With Greater than 250,000 Members | ||||
| Parent | Feb-17 | Feb-18 | Percent Growth | Feb-2018 Market Share |
| UNITEDHEALTH | 4,639,982 | 5,245,980 | 13.1% | 24.9% |
| HUMANA | 3,304,909 | 3,540,421 | 7.1% | 16.8% |
| AETNA | 1,466,009 | 1,749,708 | 19.4% | 8.3% |
| KAISER FOUNDATION | 1,517,883 | 1,578,119 | 4.0% | 7.5% |
| ANTHEM | 625,854 | 680,277 | 8.5% | 3.2% |
| BCBS OF MI | 454,106 | 518,904 | 14.3% | 2.5% |
| CIGNA | 452,508 | 434,238 | -4.0% | 2.1% |
| WELLCARE | 348,452 | 379,985 | 9.0% | 1.8% |
| HIGHMARK | 325,757 | 322,690 | -0.9% | 1.5% |
| CENTENE | 291,194 | 303,642 | 4.0% | 1.4% |
| Subtotal>250,00 | 13,428,374 | 14,753,964 | 9.9% | 70.0% |
| All Others | 6,164,967 | 6,325,697 | 2.6% | 30.0% |
| Total | 19,593,341 | 21,079,661 | 7.6% | 100.0% |
| Source: Medicare Business Online™, Mark Farrah Associates, presenting data from CMS enrollment reports | ||||
The chart below indicates membership gains were fairly substantial for the leaders in this segment. UnitedHealth experienced the largest increase in membership, adding approximately 606,000 members year-over-year, for a net gain of 13.1%. UnitedHealth continues to attribute its growth to premium and benefit stability, high star ratings and continual expansion of offerings. Aetna experienced the second most gains with nearly 283,700 new members, a 19% increase, year-over-year. Humana gained over 235,500 new members.
| MA Organizations with the Largest Gains from February 2017 to February 2018 | ||||
| Parent | Feb-17 | Feb-18 | Growth 2017-2018 | Percent Change |
| UNITEDHEALTH | 4,639,982 | 5,245,980 | 605,998 | 13.1% |
| AETNA | 1,466,009 | 1,749,708 | 283,699 | 19.4% |
| HUMANA | 3,304,909 | 3,540,421 | 235,512 | 7.1% |
| BCBS OF MI GRP | 454,106 | 518,904 | 64,798 | 14.3% |
| KAISER FOUNDATION GRP | 1,517,883 | 1,578,119 | 60,236 | 4.0% |
| ANTHEM | 626,854 | 680,277 | 53,423 | 8.5% |
| WELLCARE GRP | 348,452 | 379,985 | 31,533 | 9.0% |
| BCBS OF MN GRP | 245,411 | 270,344 | 24,933 | 10.2% |
| SPECTRUM HEALTH GRP | 124,984 | 139,449 | 14,465 | 11.6% |
| LIFETIME HLTHCARE GRP | 133,067 | 146,879 | 13,812 | 10.4% |
| Total | 12,861,657 | 14,250,066 | 1,388,409 | 10.8% |
| Source: Medicare Business Online™, Mark Farrah Associates, presenting data from CMS enrollment reports | ||||
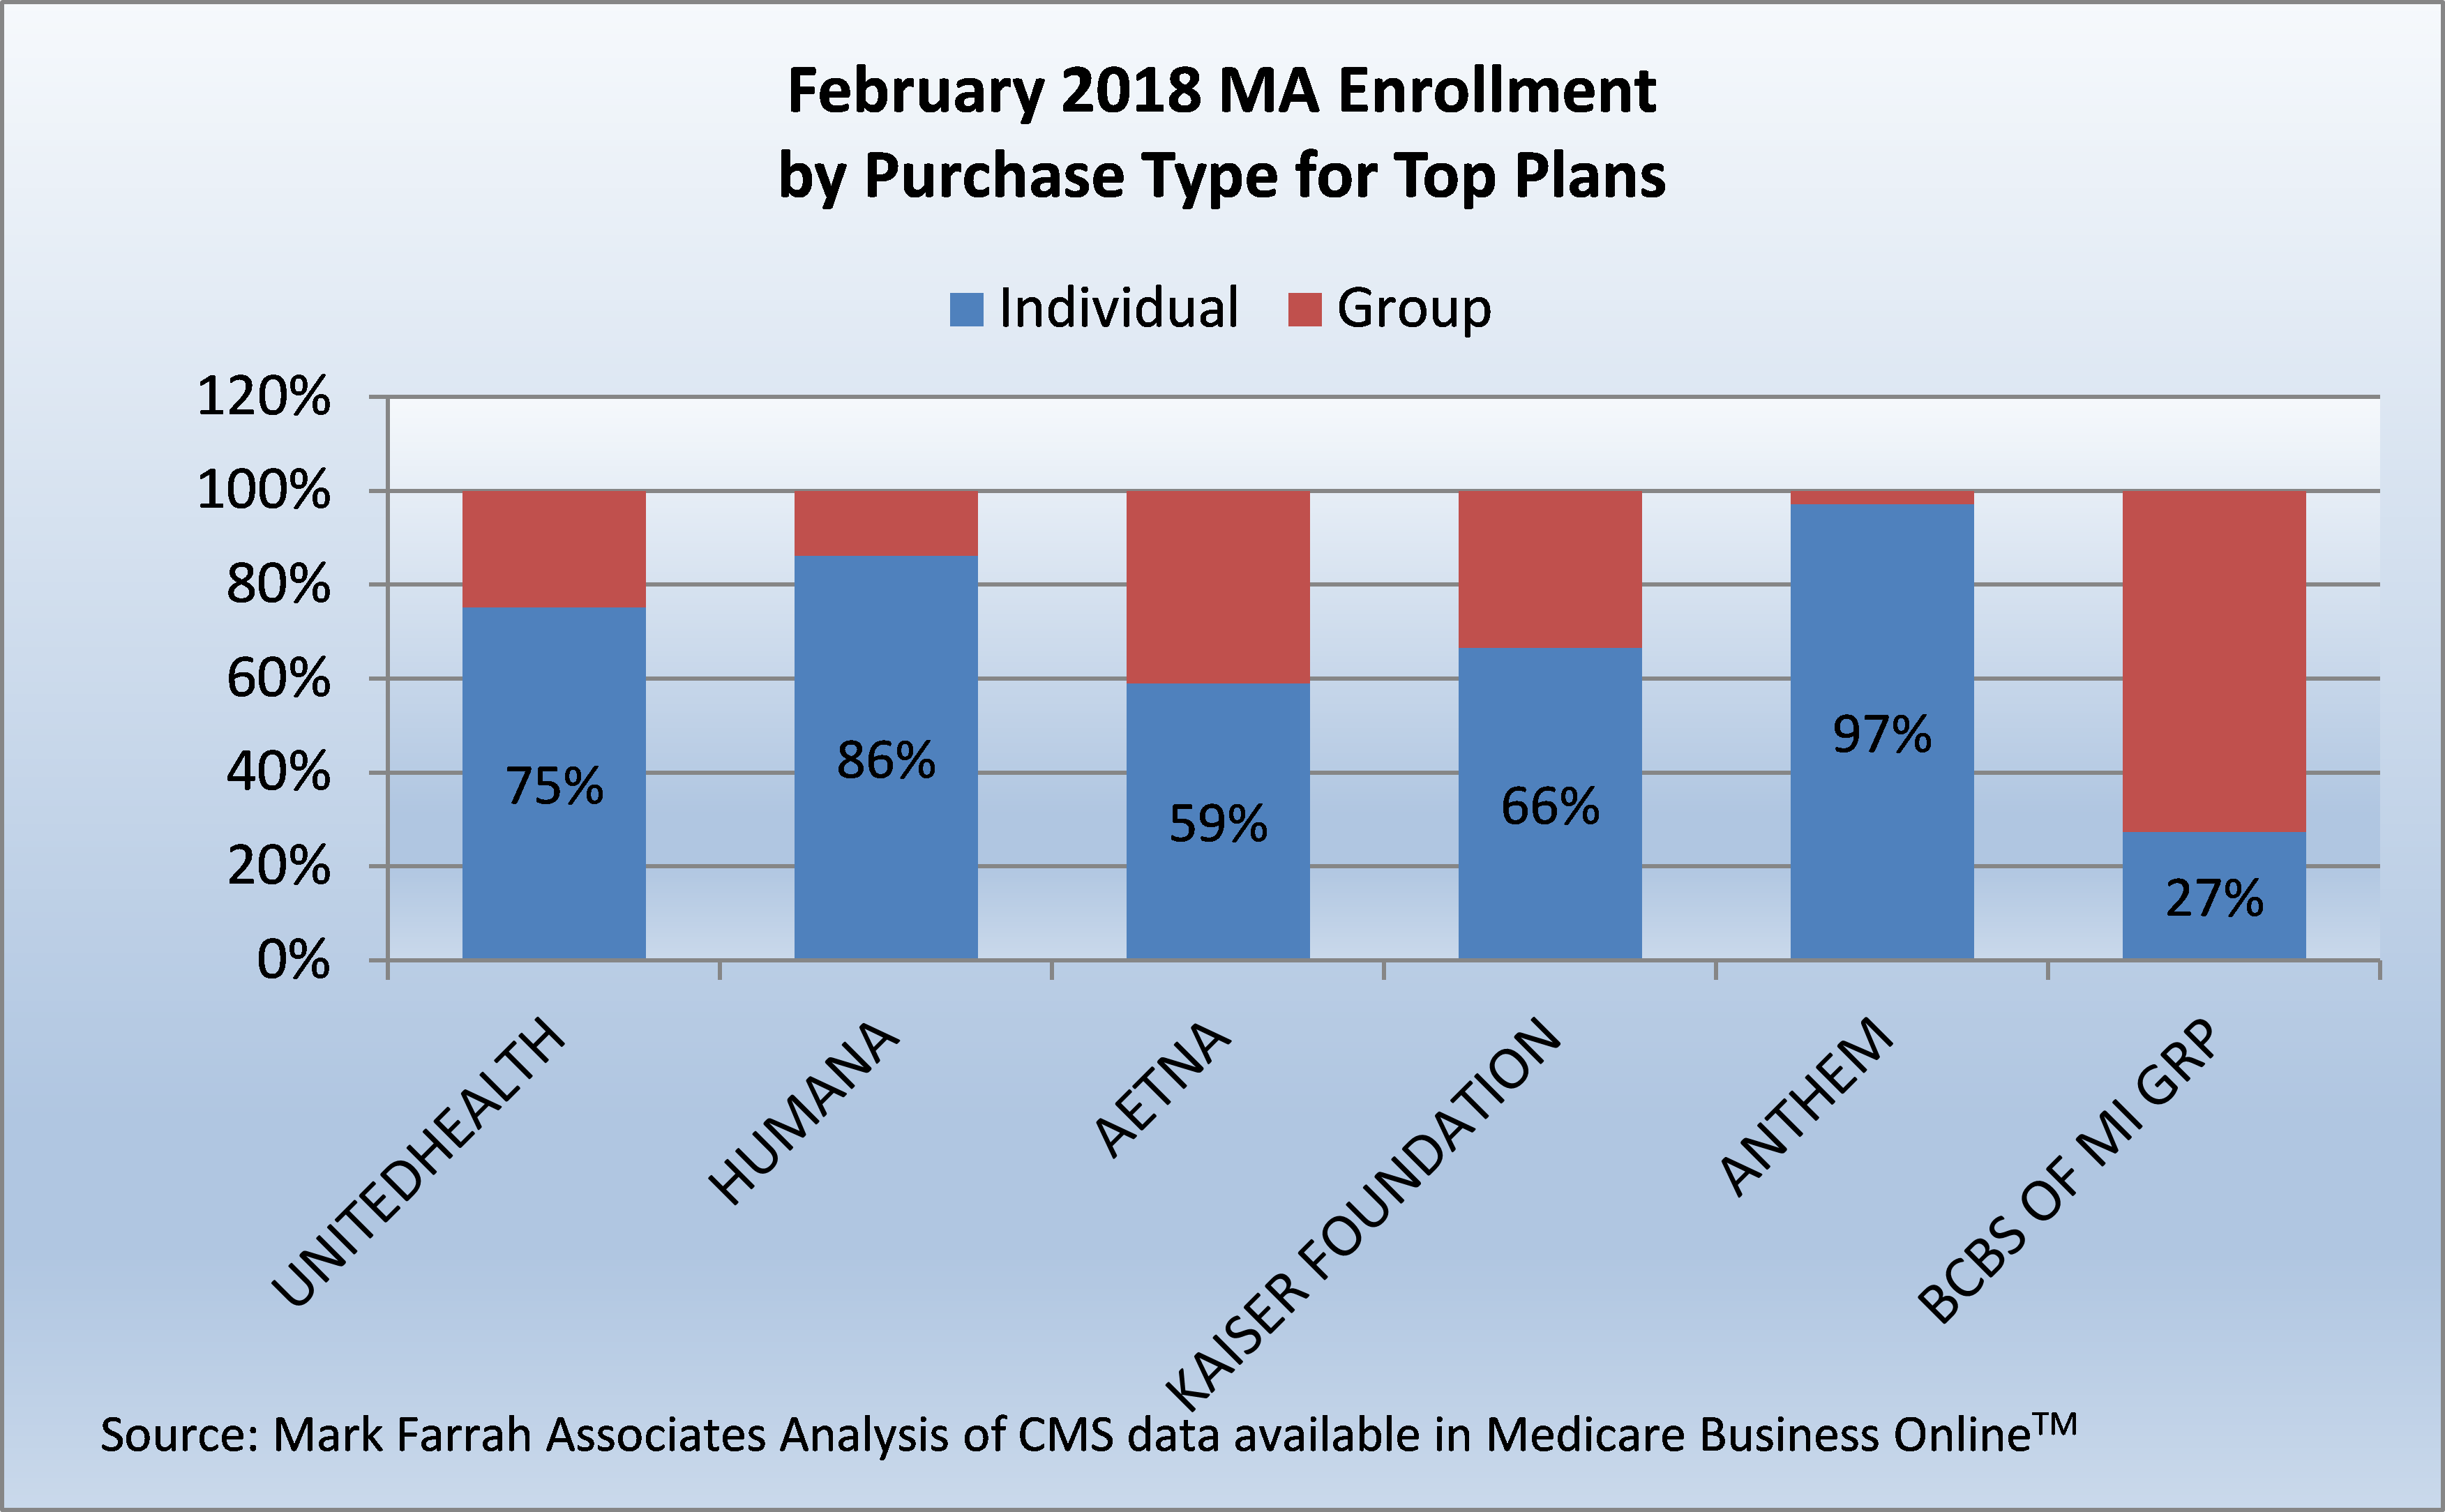
Individual versus Group Enrollment
Individual or direct purchase Medicare Advantage policies are a more popular purchase type than employer/group retiree plans. To remain competitive in this segment, plans continue to be aggressive with their marketing and selling strategies in preparation for the AEP each year. As of February 2018, approximately 16.8 million, or 80% of membership was from individual MA policies.
While only 20% of MA membership, approximately 4.1 million members, originated through an employer group health plan or retirement health benefit in February 2018, employer-group Medicare Advantage plans are a viable opportunity for employers, retirees and Medicare Advantage organizations. Enrollment in group MA plans continues to grow as these plans allow employers to provide comprehensive medical coverage and quality plan design at lower costs to seniors. Group membership saw a healthy increase of 441,645 members as compared to the same time period a year ago. Enrollment was primarily driven by UnitedHealth plan gains of 148,000 new group plan members, bringing the company’s total employer-group membership to approximately 1.3 million. Humana, Aetna, and Kaiser Foundation Group continue to have more than 480,000 members from group plans. Aetna's MA membership comprised 41% of group enrollment as of February 1, 2018.
It is important to note that MA enrollment counts by company or geography for the same reporting period may be slightly different, depending on the CMS enrollment source. CMS county-level reports do not output enrollment for plans with 10 or fewer members per county. There may likely be additional competitive shifts in enrollment and market observations through March.
Medicare Advantage Plan Types
HMOs, including those with point-of-service options, remain the dominant plan type. As of February 1, 2018, about 61% of all members were enrolled in an HMO plan. PPOs, including local and regional plans, covered 33% of MA enrollees, a 702,000 member increase from 2017.
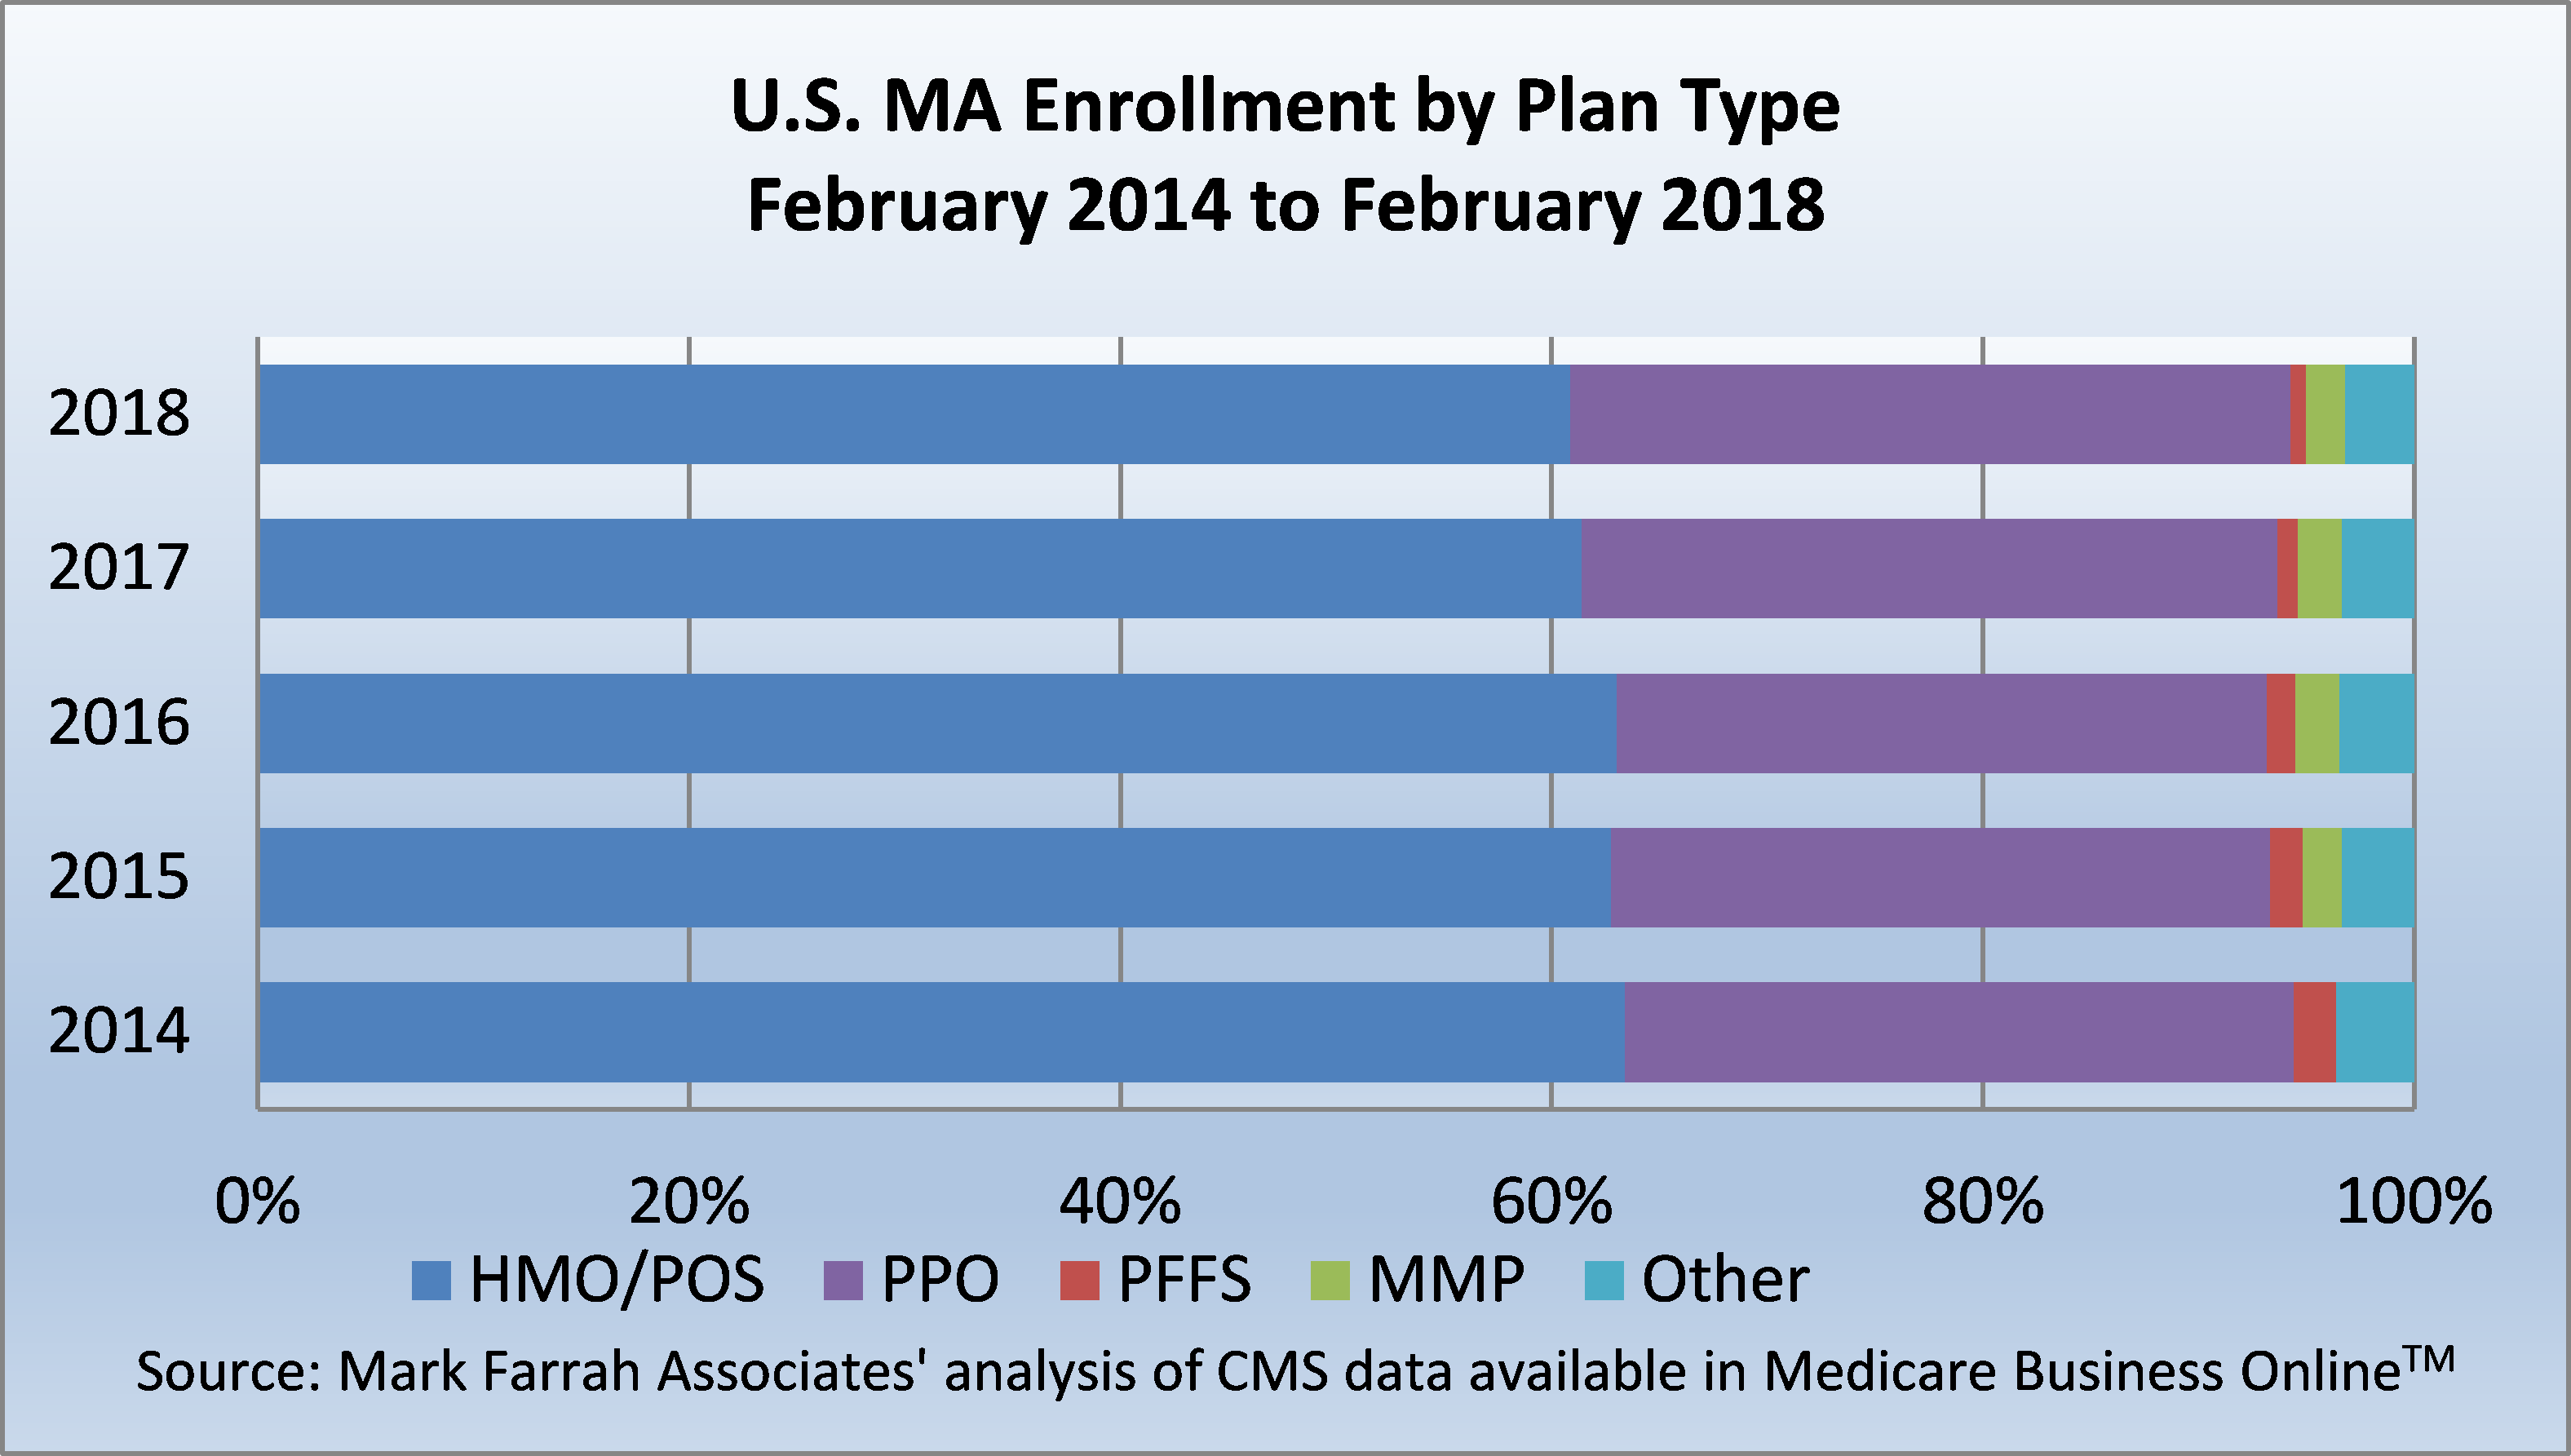
Dual eligible, or Medicare-Medicaid Plan (MMP), enrollment steadily increases year-over-year as CMS and state Medicaid agencies continue to build new programs to cover the nation’s sickest and poorest individuals. These plans enrolled nearly 377,000 members as of February 1, 2018, down slightly from 390,000 in 2017. Various MMP health plan designs, in addition to SNPs (Special Needs Plans) continue to address the needs of this high cost population. Private-fee-for-service (PFFS) plan enrollment comprised just 1% of total MA members and the "Other" plan types, including Cost or Medical Savings options, comprised 3%.
MA Enrollment Growth by State
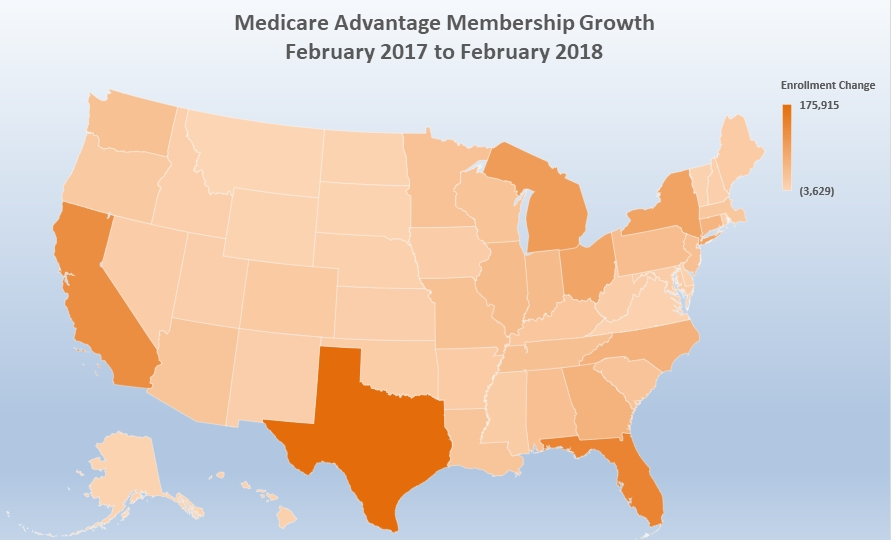
As of February 1, 2018, Medicare Advantage enrollment increased in most contiguous states with the exception of Virginia and Montana. Montana has roughly 39,000 MA beneficiaries, however, the state experienced a year-over-year decline of 3,629 MA members. This may have been due to the withdrawal of 2018 Medicare Advantage offerings in 30 counties last year. Net membership gains and losses totaled approximately 1.5 million, nationally. Texas, Florida and California all experienced significant enrollment gains with increases of 100,000 members or more. Texas experienced the most sizeable year-over-year increase of nearly 176,000 members. Insurers continue to invest in Medicare Advantage growth opportunities as the senior population expands, and Mark Farrah Associates will continue to monitor enrollment and industry shifts in this highly competitive Medicare segment.
About Mark Farrah Associates (MFA)
Mark Farrah Associates (MFA) is a leading data aggregator and publisher providing health plan market data and analysis tools for the healthcare industry. MFA’s Medicare Business Online™ (MBO) product simplifies the tracking of monthly Medicare Advantage and PDP enrollment by competitor. The Medicare Benefits Analyzer™ presents benefit copay comparisons across hundreds of benefit attributes by plan as reported in the Plan Finder on Medicare.gov. Med Supp Market Data™ offers enrollment and financial insights for companies interested in Medicare Supplement business. Our product portfolio also includes Health Coverage Portal™ (with Supplemental Health Care Exhibit data), County Health Coverage™, and Health Plans USA™.
Healthcare Business Strategy is a free monthly brief that presents analysis of important issues and developments affecting healthcare business today. If you would like to be added to our email distribution list, please submit your email to the "Subscribe to MFA Briefs" section in the grey area at the bottom of the page.