Enrollment Declines for Mid-year 2018 Health Insurance Business
September 27, 2018
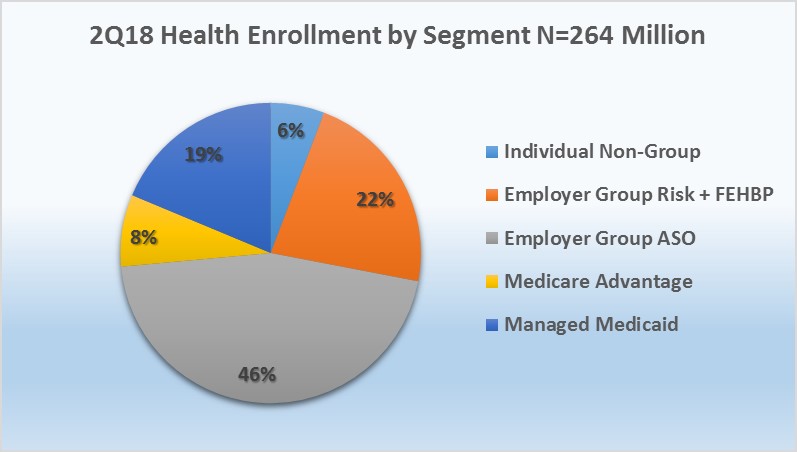
Mark Farrah Associates (MFA) assessed the latest year-over-year enrollment trends, comparing second quarter 2017 with second quarter 2018 segment membership based on data filed in statutory financial reports from the NAIC (National Association of Insurance Commissioners) and the CA DMHC (California Department of Managed Health Care). As of June 30, 2018, 264.1 million people received medical coverage from U.S. health insurers. This number is down from 264.7 million or approximately 660,000 members, from a year ago. Mid-year enrollment trends indicated continued membership gains for Medicare Advantage (MA) while Managed Medicaid, Individual, and Employer-Group risk business experienced year-over-year declines.
Segment by Segment Enrollment Trends
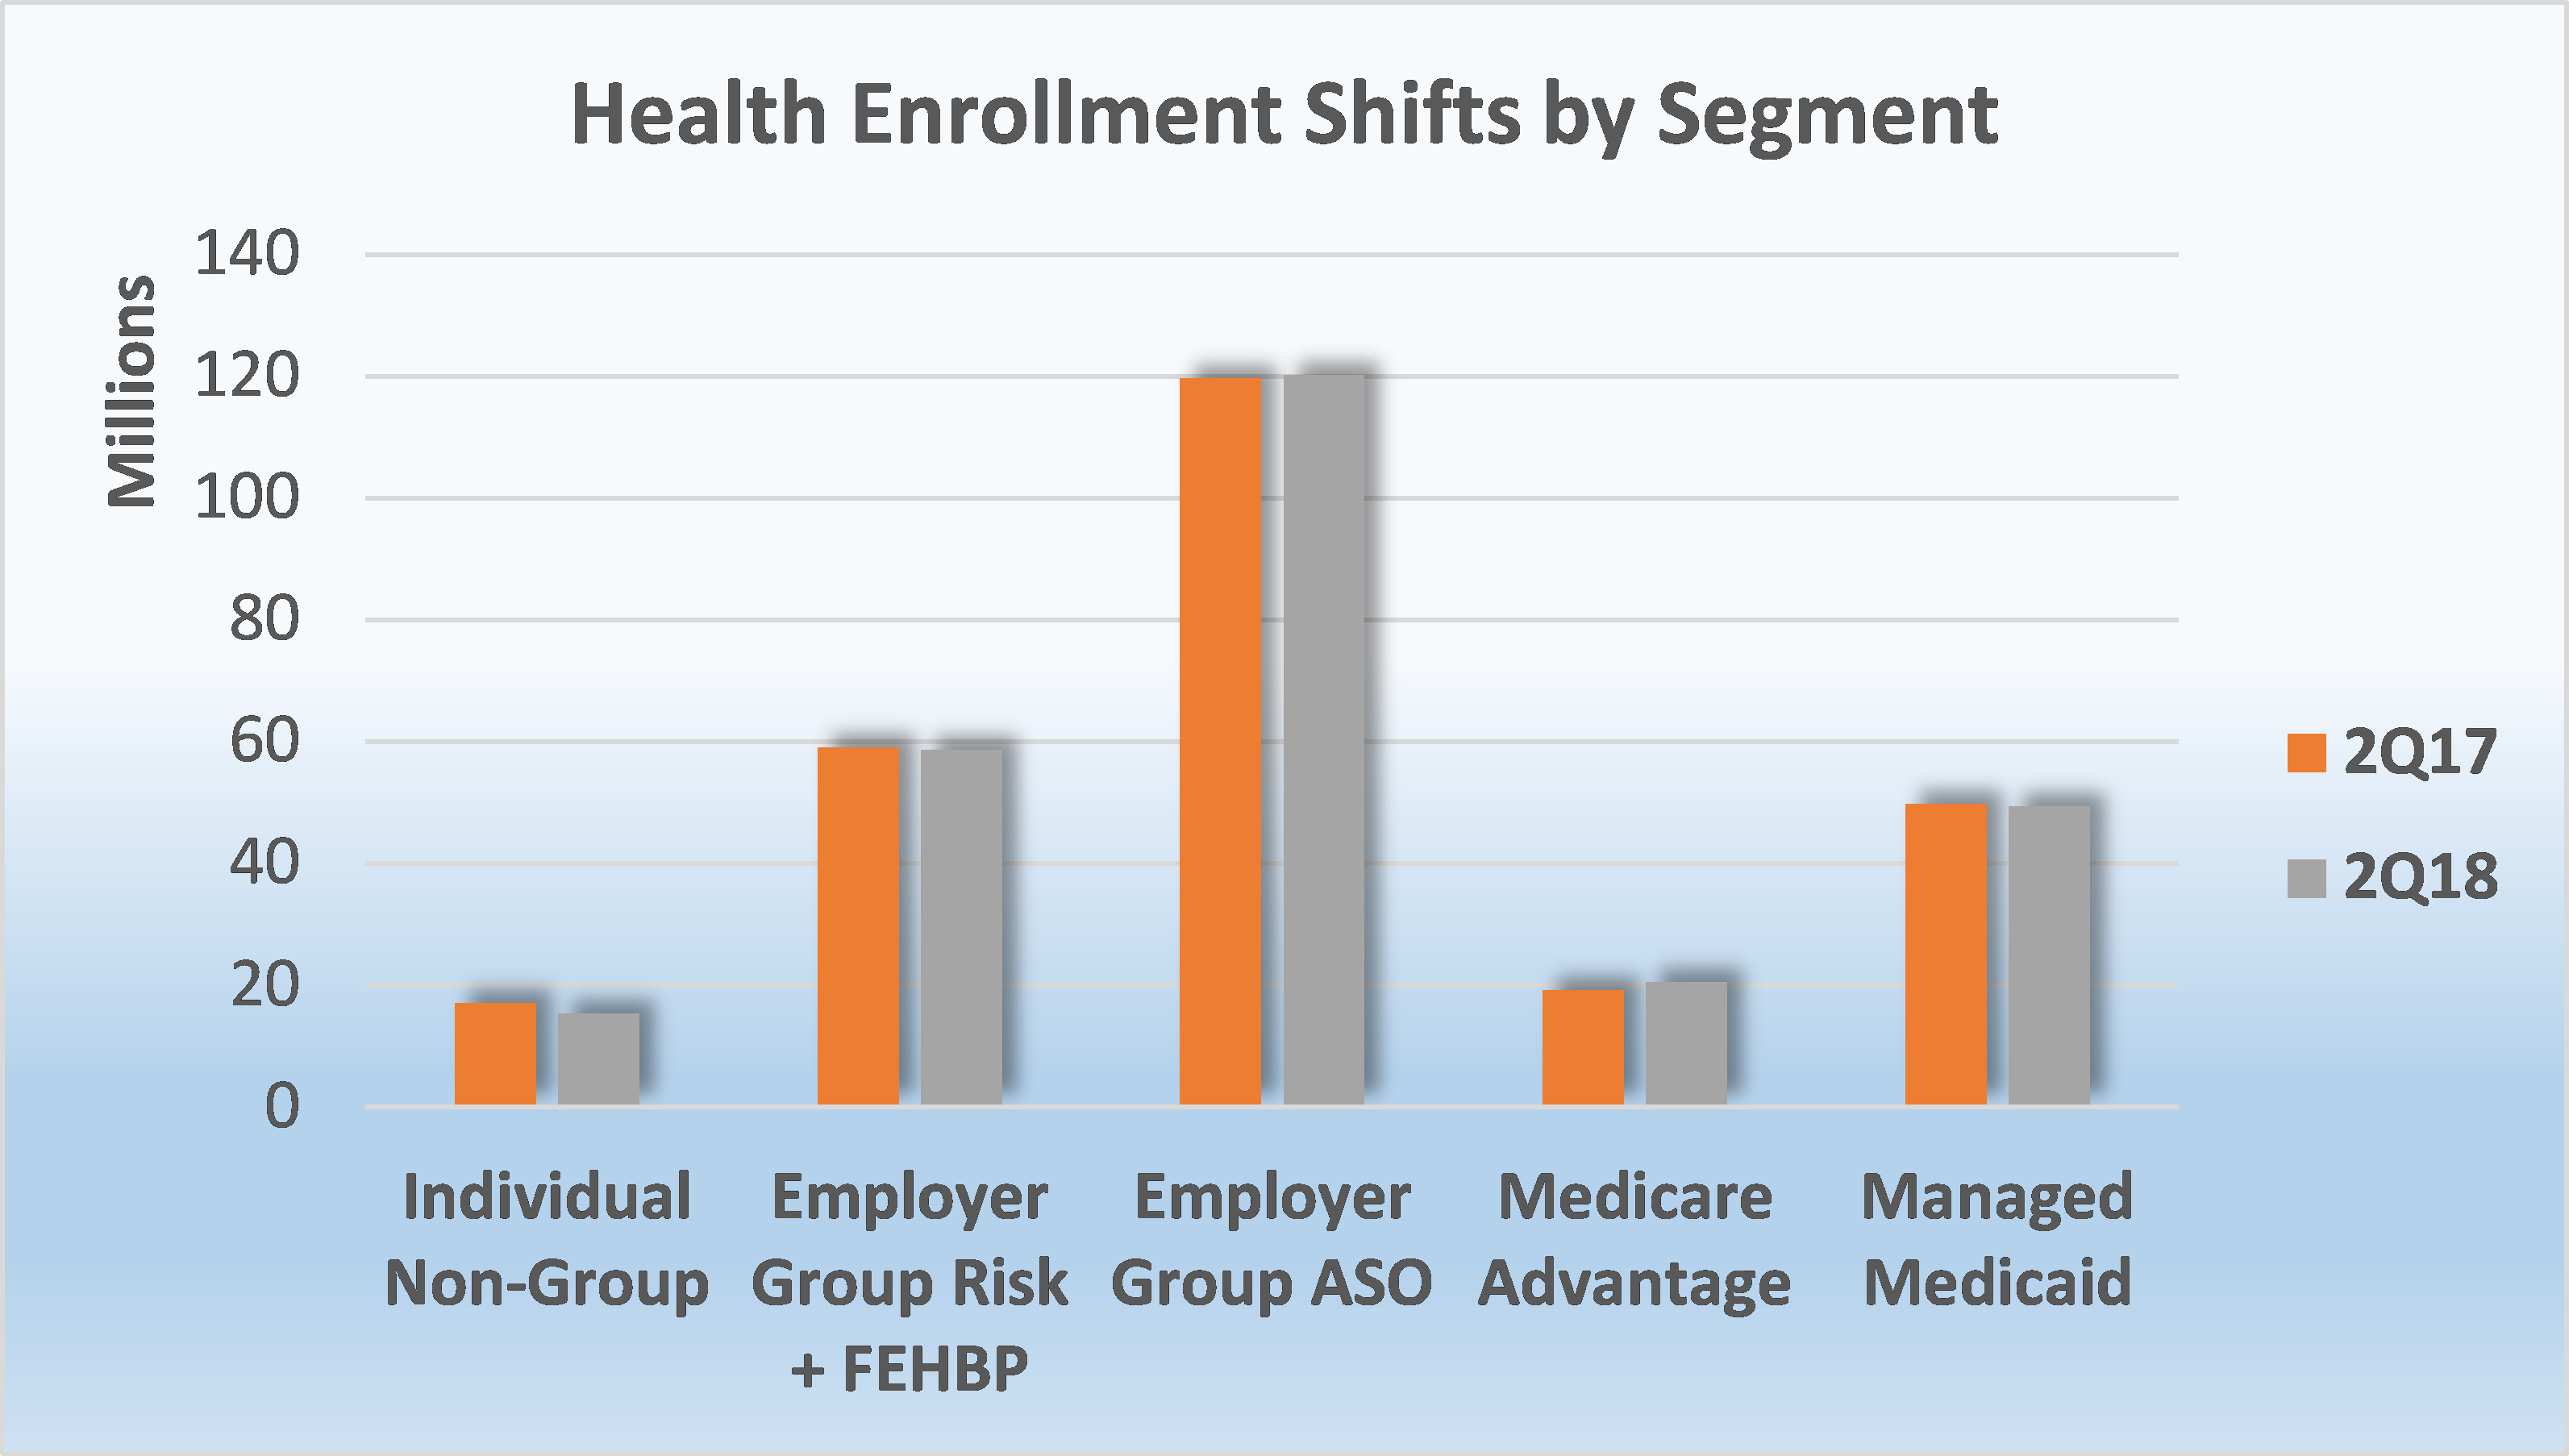
As of June 30, 2018, Medicare Advantage (MA) continued to experience a substantial membership increase as 1.2 million more seniors chose an MA plan as compared to the same period a year ago. In contrast to enrollment increases in Medicare Advantage, Managed Medicaid saw a decline of over 407,000 members, year-over-year, as compared to the addition of 1.35 million Medicaid beneficiaries between second quarter 2016 and second quarter 2017. On and off exchange, individual business lost approximately 1.7 million members, and the Employer-Group risk segment including Federal Employees Health Benefit Plans (FEHBP) business experienced a decline of over 327,000 members. Over the same period, the Employer-Group ASO segment collectively enrolled 120.2 million people at mid-year 2018, a gain of over 541,000 members.
 Source: Health Coverage Portal TM, Mark Farrah Associates
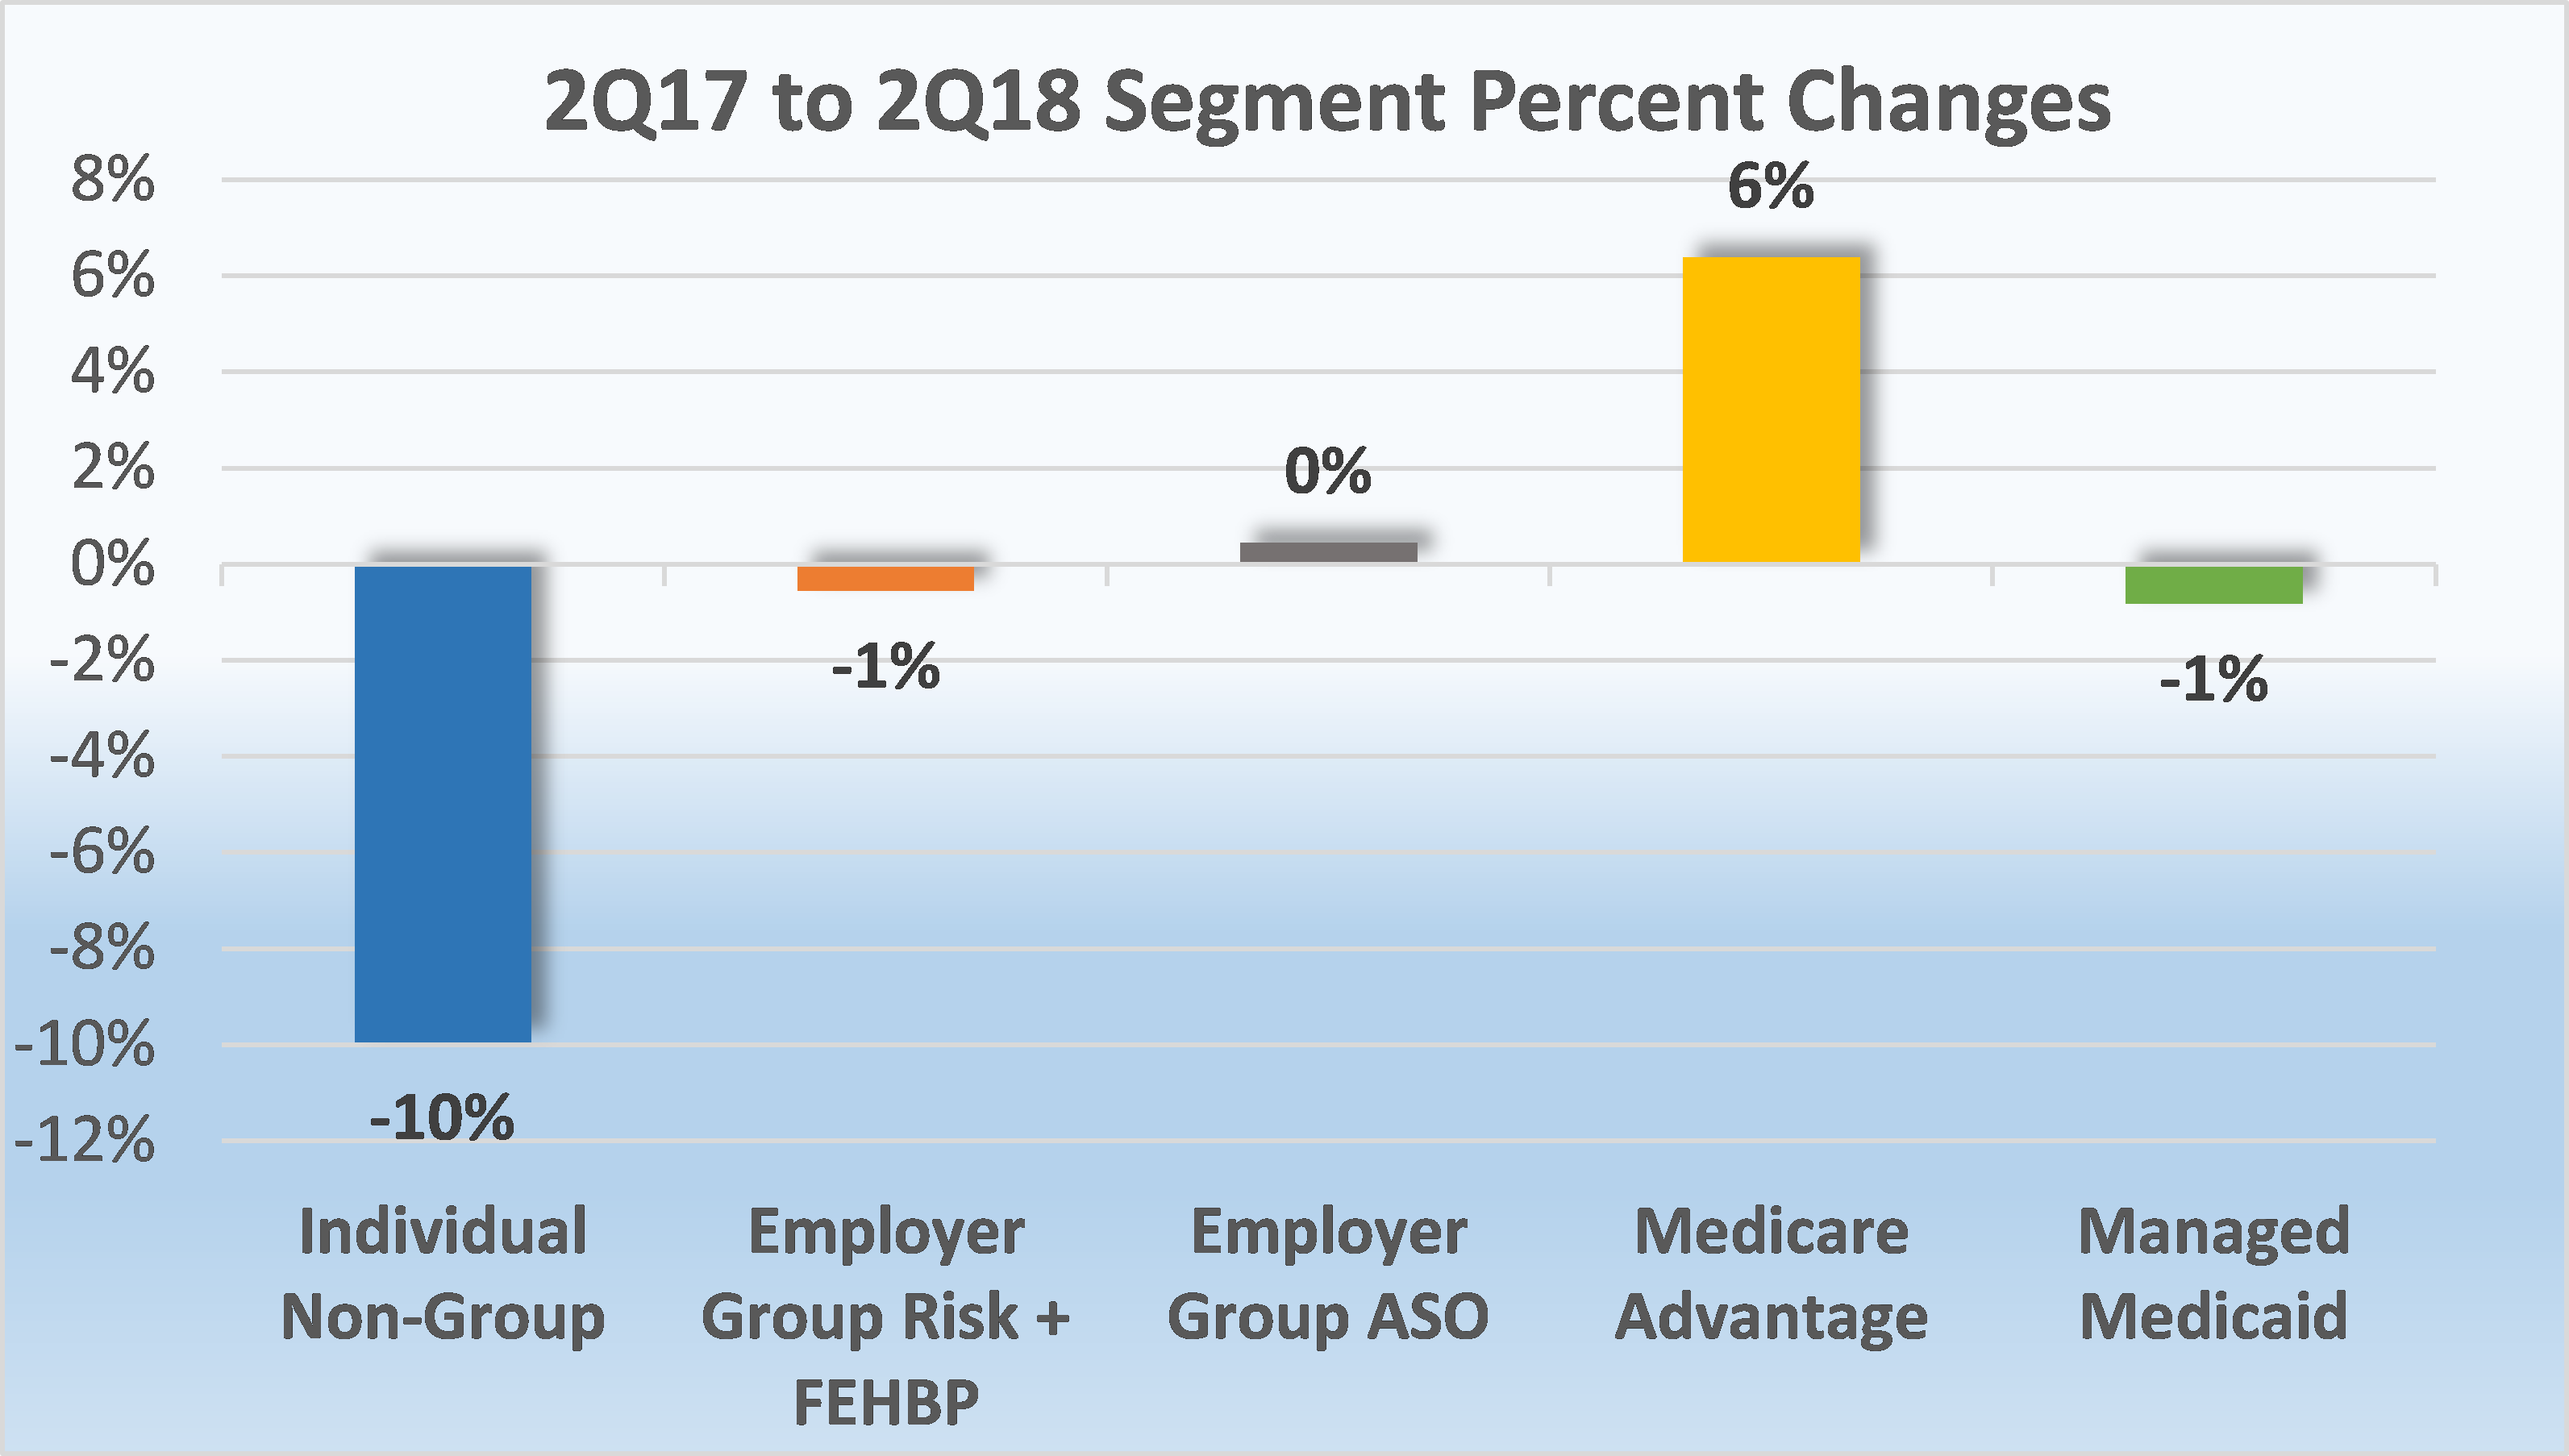
- Individual, non-group business continued to experience enrollment declines between June 30, 2017 and June 30, 2018. Total year-over-year membership for this segment decreased by 10% from just over 17 million enrollees to 15.3 million. This departure of roughly 1.7 million people from the overall individual market is largely contributed to market enrollment in off-exchange plans.
Although the individual segment continues to bear the burden of healthcare debate and membership in this sector has steadily declined, there are favorable indications of improvement for the coming year. The Affordable Care Act's (ACA’s) on-exchange program has historically been unsustainable due to increased medical claims, premiums, adverse selection, and immature risk pools, forcing several insurer exits from the Marketplace and resulting in fewer plan options for individuals. However, insurers reported more stable financial results for their exchange business in 2018, and many are considering expansion plans for 2019. Nonetheless, further revisions to the law will likely impact the future of on-exchange business. In addition, according to a Kaiser Family Foundation article, Changes in Enrollment in the Individual Health Insurance Market, the decline in overall individual enrollment was primarily a result of off-exchange market membership due to significant premium increases in 2017 and 2018. As the 2019 open enrollment period, which runs from November 1, 2018 through December 15, 2018, is soon approaching, individual market stability remains a wait and see proposition for the health insurance industry.
- Managed Medicaid membership marginally decreased by 1%, or 407,000 enrollees from 2Q17 to 2Q18. This was down from the 2.8% growth seen in the 2017 mid-year comparisons. Based on data filed in statutory financial reports, approximately 49.4 million Medicaid beneficiaries received healthcare through Managed Care Organizations (MCOs) in second quarter 2018, but it’s important to note that some plans submit special performance reports to the state and are not required to file NAIC statutory financial statements or the CA DMHC. According to the Centers for Medicare & Medicaid Services (CMS), however, nearly 73.4 million individuals were enrolled in Medicaid and the Children’s Health Insurance Program (CHIP) as of June 2018, down 1.4 million since June 2017.
Even with recent declines in membership, Medicaid continues to be the largest health program in the United States as measured by enrollment. Medicaid funding is compounded by rising medical costs and tight state budget constraints as it also continues to be the largest state budgetary expenditure. Currently, 34 states including the District of Columbia have chosen to expand their Medicaid programs under the ACA, with Virginia being the latest to adopt Medicaid expansion after passage through the state Senate this past May.
Of the 17 states that have not expanded, Utah, Idaho and Nebraska continue to consider Medicaid expansion. Alabama and Michigan recently submitted waiver requests for Medicaid work requirements to the CMS. With a proposed start date of January 1, 2020, the conditions require beneficiaries to work 80 hours per month in order to remain covered under Medicaid. If this were to pass, the total number of states with approved work requirements through the CMS would increase from four to six. On the other hand, California is seeking to prohibit its health department from seeking a waiver that would impose Medicaid work requirements. If approved, California would be the first state to prohibit Medicaid work requirements.
- The Medicare Advantage market remains strong with continued opportunity for growth year-over-year. According to plan-reported statutory reports, enrollment in MA plans increased from 19.2 million as of June 30, 2017 to almost 20.5 million mid-year 2018. This is a steady increase of 6% growth which will most likely continue as an estimated 10,000 baby boomers retire each day.
As previously mentioned in MFA’s recent brief, Mid-Year 2018 Health Insurance Segment Profitability Insights, with continued efforts to regulate policies and provide more flexibility for MA programs, the Centers for Medicare and Medicaid Services (CMS) issued final updates to the Medicare Advantage and Part D Prescription Drug programs for 2019 in its Final Rule. Some major provisions for CY 2019 include changes to benefit uniformity requirements, marketing rules, and the star rating process. In addition, a 3.4% on average rate increase is expected for Medicare Advantage and Part D plans in 2019, a significant increase from the 1.84% percent rate increase proposed in the February Advanced Notice and Draft Call Letter. MA plans will compete by offering new pricing and product options to beneficiaries with the Annual Election Period (AEP) for Medicare Advantage and prescription drug plans beginning October 15, 2018. Stay tuned for MFA’s Business Strategy Brief in October that will present a snapshot of the 2019 Medicare Advantage market with insights on plans that will be vying for business during the upcoming AEP.
 Source: Health Coverage Portal TM, Mark Farrah Associates
- Employer-Groups continue to be the leading source of health coverage in the U.S. The latest figures show Employer-Group risk membership, including Federal Employees Health Benefit Plans (FEHBP) enrollment, experienced a slight 1% decline between 2Q17 and 2Q18. Year-over-year membership for this segment marginally decreased by approximately 327,000 people as more employers continue to shift towards self-funded (ASO) insurance as a way to reduce costs.
- According to MFA’s recent estimates, employer group ASO (administrative services only for self-funded business) membership grew by just over 541,000 members from June 2017 to June 2018. MFA identified 120.2 million ASO covered lives, which encompassed 46% of total health enrollment by segment for 2Q18.
Source: Health Coverage Portal TM, Mark Farrah Associates
About the Data
The data used in this analysis brief was obtained from Mark Farrah Associates' Health Coverage Portal™ database. It is important to note that MFA estimated second quarter 2018 enrollment for a small number of health plans that are required to report quarterly enrollment but hadn’t yet filed. Employer group ASO figures may be estimated by Mark Farrah Associates using credible company and industry resources. Individual, Non-Group membership reported by some carriers may include CHIP (Children’s Health Insurance Program).
These adjustments may have resulted in moderate understatement or overstatement of enrollment changes by segment. Findings reflect enrollment reported by carriers with business in the U.S. and U.S. territories. Data sources include NAIC (National Association of Insurance Commissioners) and the CA DMHC (California Department of Managed Health Care). As always, MFA will continue to report on important plan performance and competitive shifts across all segments.
About Mark Farrah Associates (MFA)
Mark Farrah Associates (MFA) is a leading data aggregator and publisher providing health plan market data and analysis tools for the healthcare industry. Our product portfolio includes Health Coverage Portal™, County Health Coverage™, Medicare Business Online™, Medicare Benefits Analyzer™, and Health Plans USA™. For more information about these products, refer to the informational videos and brochures available under the Our Products section of the website or call 724-338-4100.
Healthcare Business Strategy is a free monthly brief that presents analysis of important issues and developments affecting healthcare business today. If you would like to be added to our email distribution list, please submit your email to the "Subscribe to MFA Briefs" section in the grey area at the bottom of the page.
Request Information
within 1-2 business days.