Continued Year-Over-Year Medicare Advantage and PDP Membership Increases
March 28, 2019
The Annual Election Period (AEP) for Medicare Advantage (MA) and prescription drug plans (PDPs) runs each year from October 15th through December 7th. Health companies compete by offering new pricing and product options to beneficiaries during the AEP. Plans then begin to analyze final enrollment results in February and March to evaluate their standing and assess which competitors gained and lost members during the last AEP. Many companies conduct their post-AEP competitive assessments by using tools such as Mark Farrah Associates’ (MFA) Medicare Business Online™ and Health Coverage Portal™. As of March 1, 2019, total Medicare Advantage, including Medicare Advantage with Prescription Drug Plan (MA-PD) membership stood at 22,654,276 with a net gain of 1,554,366 members, year-over-year. Medicare stand-alone prescription drug plans (PDPs) covered 25,559,801 members as of March 1, 2019, a gain of 38,835 from the previous year. This brief assesses Medicare Advantage and PDP performance, market share and market penetration by state as of March 1, 2019.
MA Competitive Dynamics
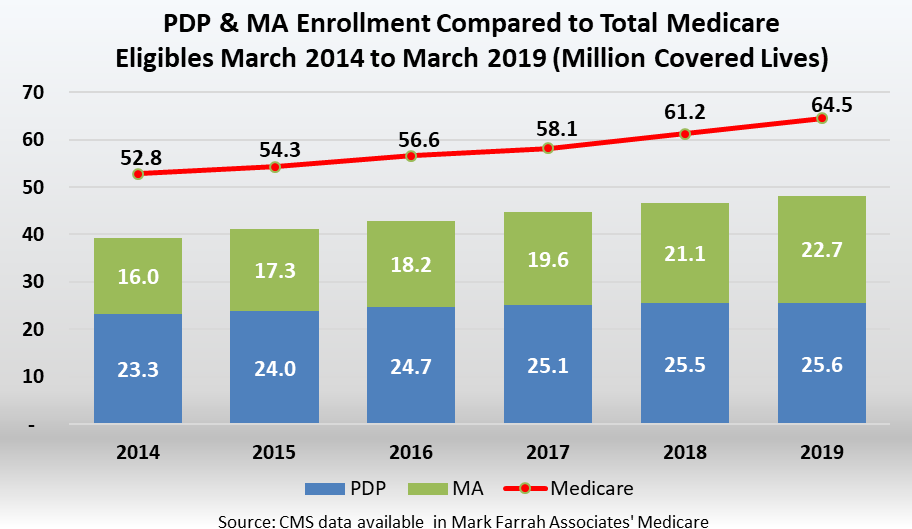
Medicare Advantage (MA) market penetration remains strong; however, there is still abundant opportunity for growth with only 35% of the 64.5 million people eligible for Medicare. According to CMS Medicare Advantage enrollment reports aggregated by MFA in Medicare Business Online™, total Medicare Advantage plan enrollment as of March 1, 2019 increased 7.4% from March 2018. The top ten companies, each with more than 250,000 members in this segment, collectively provide coverage for 73.5% of the market. Per the reference tables below, most leading MA companies realized year-over-year growth with the exception of Wellcare and Highmark. The overall net gain for the ten companies was over 11 percent.
UnitedHealth continues to dominate in this highly competitive segment. With approximately 5.77 million enrolled, UnitedHealth commands 25.5% of the Medicare Advantage market. Humana ranks second with 17.5% market share and 3.96 million lives. Aetna maintains the third position, enrolling over 2.25 million, and Kaiser Foundation Group follows with over 1.63 million lives.
| March 2019 Top 10 MA Organizations | ||||
| Parent | Mar-18 | Mar-19 | Percent Growth | March 2019 Market Share |
| UNITEDHEALTH | 5,255,269 | 5,767,735 | 9.8% | 25.5% |
| HUMANA | 3,535,260 | 3,960,480 | 12.0% | 17.5% |
| AETNA | 1,751,605 | 2,255,535 | 28.8% | 10.0% |
| KAISER | 1,582,294 | 1,633,597 | 3.2% | 7.2% |
| ANTHEM | 857,984 | 1,071,879 | 24.9% | 4.7% |
| BCBS OF MI | 518,124 | 520,824 | 0.5% | 2.3% |
| CIGNA | 433,809 | 442,745 | 2.1% | 2.0% |
| WELLCARE | 433,221 | 423,701 | -2.2% | 1.9% |
| CENTENE | 302,543 | 303,807 | 0.4% | 1.3% |
| HIGHMARK | 321,976 | 279,762 | -13.1% | 1.2% |
| Subtotal Top 10 | 14,992,085 | 16,660,065 | 11.1% | 73.5% |
| All Others | 6,107,825 | 5,994,211 | -1.9% | 26.5% |
| Total | 21,099,910 | 22,654,276 | 7.4% | 100.0% |
Source: Medicare Business OnlineTM, Mark Farrah Associates, presenting data from CMS enrollment reports |
||||
The chart below indicates membership gains were considerable for the leaders in this segment. UnitedHealth’s growth continues to raise the bar for MA plan competition. UnitedHealth reported the largest increase in membership, adding over 512,000 members year-over-year, for a net gain of 9.8%. Aetna increased its geographic footprint to 358 new counties in 6 new states and expanded its plan benefit offerings for 2019, experiencing the second largest gains with nearly 504,000 new members. Humana and Anthem gained over 425,000 and 213,000 new members, respectively.
| MA Organizations with the Largest Gains from March 2018 to March 2019 | ||||
| Parent | Mar-18 | Mar-19 | Growth 2018-2019 | Percent Change |
| UNITEDHEALTH | 5,255,269 | 5,767,735 | 512,466 | 9.8% |
| AETNA | 1,751,605 | 2,255,535 | 503,930 | 28.8% |
| HUMANA | 3,535,260 | 3,960,480 | 425,220 | 12.0% |
| ANTHEM | 857,984 | 1,071,879 | 213,895 | 24.9% |
| KAISER | 1,582,294 | 1,633,597 | 51,303 | 3.2% |
| MMM HLTHCARE | 197,330 | 235,218 | 37,888 | 19.2% |
| UNIVERSAL AMERICAN FINANCIAL CORPORATION | 82,757 | 111,136 | 28,379 | 34.3% |
| UCARE | 94,130 | 118,864 | 24,734 | 26.3% |
| TRIPLE S | 112,476 | 127,940 | 15,464 | 13.7% |
| UPMC | 176,534 | 191,023 | 14,489 | 8.2% |
| Total | 13,645,639 | 15,473,407 | 1,827,768 | 13.4% |
Source: Medicare Business OnlineTM, Mark Farrah Associates, presenting data from CMS enrollment reports |
||||
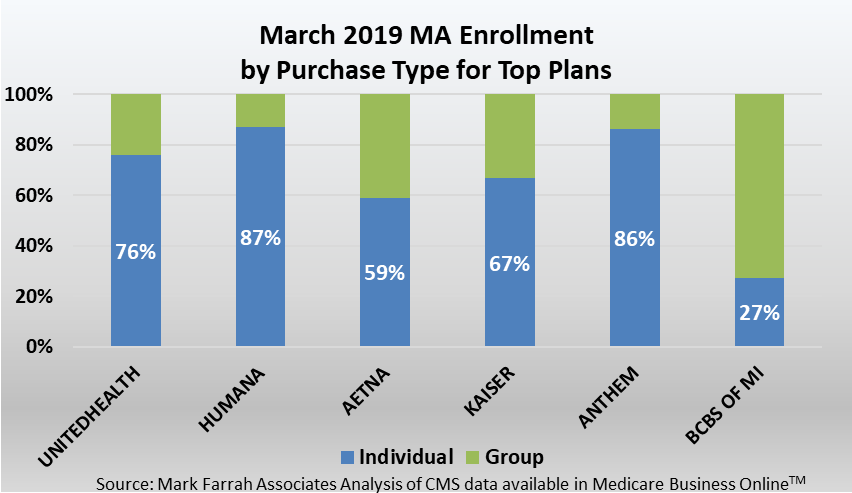
MA Individual and Group Enrollment
Individual, or direct purchase Medicare Advantage, policies are the more popular purchase type over employer/group retiree plans. As of March 2019, 80% of membership was from individual MA policies with approximately 17.9 million enrolled lives. In contrast, approximately 4.4 million members originated through an employer group health plan or retirement health benefit as of March 2019. Employer-group Medicare Advantage plans continue to be a viable opportunity for employers, retirees and Medicare Advantage carriers. Enrollment in group MA plans continues to grow as these plans allow employers to provide comprehensive medical coverage and quality plan design at lower costs to seniors. Group membership increased by 340,626 members as compared to the same time period a year ago. Enrollment was primarily driven by UnitedHealth plan gains of 93,524 new group plan members, bringing the company’s total employer-group membership to approximately 1.39 million. Aetna's group MA membership stood at 911,194, comprising 41% of group enrollment as of March 1, 2019. Humana and Kaiser Foundation Group continued to have more than 500,000 members from group plans.
It is important to note that MA enrollment counts by company or geography for the same reporting period may be slightly different, depending on the CMS enrollment source. CMS county-level reports do not output enrollment for plans with 10 or fewer members per county. There may likely be additional competitive shifts in enrollment and market observations through March.
Medicare Advantage Plan Types
HMOs, including those with point-of-service options, remain the predominant plan type. As of March 1, 2019, about 61% of all members were enrolled in an HMO plan. PPOs, including local and regional plans, covered 36% of MA enrollees, a 1.1 million member increase from 2018.
Enrollment increased year-over-year for the Dual eligible population, or Medicare-Medicaid Plans (MMPs), as CMS and state Medicaid agencies continue to build new programs. Various MMP health plan designs address the needs of the nation’s sickest and poorest individuals. These plans enrolled over 380,000 members as of March 1, 2019, up from the 376,000 in 2018. Private-fee-for-service (PFFS) plan enrollment comprised just 1% of total MA members and the "Other" plan types, including Cost or Medical Savings options, comprised 1%.
MA Enrollment Growth by State
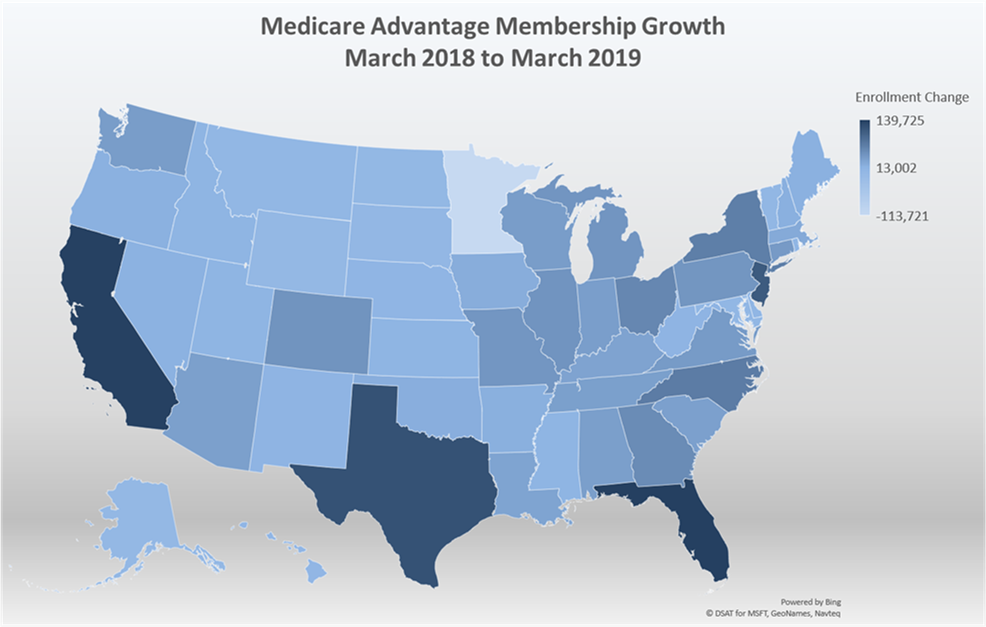
As of March 1, 2019, Medicare Advantage enrollment increased in most contiguous states with the exception of Minnesota. Federal law eliminated Medicare 1876 Cost health plans across 66 counties in Minnesota for 2019, which likely contributed to the nearly 114,000 member decrease. Many of those impacted by this change may have chosen to stay with original Medicare and have opted to purchase Medigap policies for additional coverage.
California reported the largest MA enrollment of 2.7 million as of March 1, 2019. Overall, a net membership gain of approximately 1.6 million was seen nationally. Texas, Florida, New Jersey and California all experienced significant enrollment gains with increases of 100,000 members or more. Florida experienced the most sizable year-over-year increase of nearly 140,000 members.
Medicare Prescription Drug Plan Enrollment Growth
Stand-alone prescription drug plans (PDPs), also referred to as Medicare Part D stand-alone plans, enrolled nearly 25.6 million people as of March 1, 2019, an increase of approximately 38,835 enrollees from March 2018. PDP plans provide prescription drug coverage for 40% of the 64.5 million people eligible for Medicare as of March 2019. Enrollment in products sold to individuals was 20,573,911 in March 2019, a decrease of 64,000, year-over-year. While only 4.58 million Medicare beneficiaries were enrolled in employer group PDPs as of March 1, 2019, group enrollment grew by approximately 80,000 members since March 2018. It is important to note this assessment is reporting on Stand-alone PDP members only, and Medicare Advantage with prescription drug plan (MA-PD) members are not included in this analysis.
PDP Leading Plan Performance
There are currently around 50 organizations competing in Medicare stand-alone prescription drug plans (PDPs) as of March 2018. Eight companies have greater than 600,000 members and command 92.3% of the PDP market. Five of these plans control 80% of the market covering 2 million members or more. Per the chart below, CVS Caremark covers the largest number of people in PDPs; however, CVS saw a 0.9% decrease in enrollment between March 2018 and March 2019. Among the top eight PDP carriers, Wellcare experienced the most sizable percentage of year-over-year enrollment growth with nearly 50% membership gain. Express Scripts, Aetna, Cigna, and Envision also had enrollment increases, respectively.
| March 2019 Top PDP Organizations | ||||
| Parent | Mar-18 | Mar-19 | Percent Growth | March 2019 Market Share |
| CVS CAREMARK | 6,121,369 | 6,067,720 | -0.9% | 23.7% |
| UNITEDHEALTH | 5,403,946 | 5,159,930 | -4.5% | 20.2% |
| HUMANA | 4,932,043 | 4,339,785 | -12.0% | 17.0% |
| EXPRESS SCRIPTS | 2,478,587 | 2,500,097 | 0.9% | 9.8% |
| AETNA | 2,162,105 | 2,452,101 | 13.4% | 9.6% |
| WELLCARE | 1,086,751 | 1,626,264 | 49.6% | 6.4% |
| CIGNA | 790,891 | 808,858 | 2.3% | 3.2% |
| ENVISION INS | 523,019 | 634,499 | 21.3% | 2.5% |
| Subtotal | 23,498,711 | 23,589,254 | 0.4% | 92.3% |
| All Others | 2,022,255 | 1,970,547 | -2.6% | 7.7% |
| Total | 25,520,966 | 25,559,801 | 0.2% | 100.0% |
Source: Medicare Business OnlineTM, Mark Farrah Associates, presenting data from CMS enrollment reports |
||||
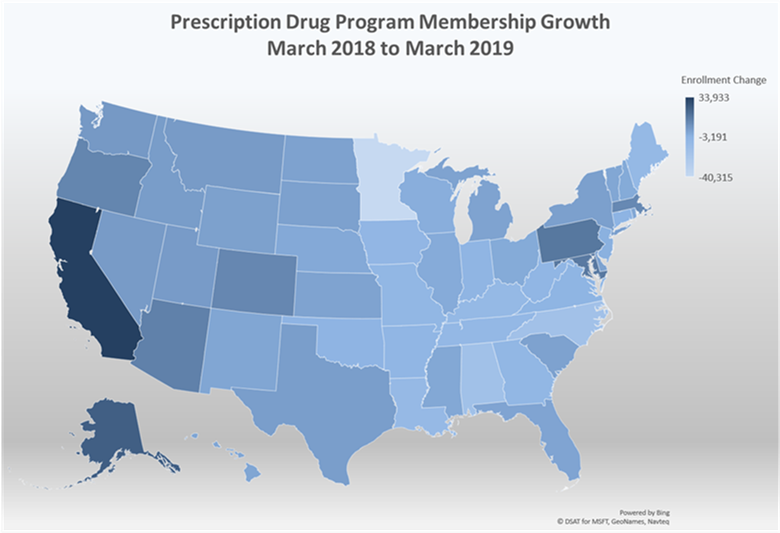
PDP Market Penetration by State
Stand-alone prescription drug plan enrollment decreased in 22 states within the contiguous U.S, including the District of Columbia, as of March 1, 2019. Minnesota had the largest year-over-year aggregate decrease with over 40,000 fewer members in this segment. California, with over 2.3 million members with prescription drug coverage, saw the most sizable increase of 34,000 more PDP members from the prior year. Alaska experienced the second most enrollment gains with an increase of 24,000 members.
Conclusion
Medicare Advantage plans remain appealing to the senior population as these plans often provide extra benefits and services at lower costs over original Medicare. In addition, stand-alone PDPs remain a viable option for seniors because so many on original Medicare routinely depend on medication. Health insurers continue to invest in MA and PDP growth opportunities for increased enrollment, revenue and profits as the number of people entering retirement increases each year. Furthermore, new for 2019, enrollees have the opportunity to switch to another plan during the first three months, which could further cause additional shifts in MA plan enrollment. Mark Farrah Associates will continue to monitor plan performance in this highly competitive Medicare segment.
About this Data
This brief is based on an analysis of enrollment data for Medicare Advantage and Prescription Drug Plans (PDPs) released by the Centers for Medicare & Medicaid Services (CMS). Mark Farrah Associates’ Medicare Business Online™ (MBO) simplifies the tracking of monthly Medicare Advantage and PDP enrollment by competitor. Enrollment data is updated monthly as soon as CMS releases new data. Additionally, using MFA’s Medicare Benefits Analyzer™ (MBA), health companies are comparing and analyzing 2018 benefit packages and developing strategies to offer 2019 products that will attract and benefit seniors while ensuring the company is not adversely selected.
About Mark Farrah Associates (MFA)
Mark Farrah Associates (MFA) is a leading data aggregator and publisher providing health plan market data and analysis tools for the healthcare industry. Our product portfolio includes Health Coverage Portal™, County Health Coverage™, Medicare Business Online™, Medicare Benefits Analyzer™, and Health Plans USA™. For more information about these products, refer to the informational videos and brochures available under the Our Products section of the website or call 724-338-4100.
Healthcare Business Strategy is a FREE monthly brief that presents analysis of important issues and developments affecting healthcare business today. If you would like to be added to our email distribution list, please submit your email address to the "Subscribe to MFA Briefs" section at the bottom of this page.