An Analysis of Profitability for the Individual and Small Group Health Insurance Markets in 2020
August 31, 2021
Health plans across the country submitted their Supplemental Health Care Exhibits (SHCE) on April 1, 2021, as part of the 2020 National Association of Insurance Commissioners’ (NAIC) annual financial statements. The SHCE contains financial performance metrics, membership, and Preliminary MLR at the state level. Subscribers to Mark Farrah Associates’ (MFAs) Health Coverage Portal or the SHCE & MLR Data have access to this important information. MFA examined some key findings from its latest analysis of the SHCE, including a focus on performance within Individual and Small Group comprehensive insurance segments. Plans in these two segments face the added constraint of a standard (minimum) MLR (Medical Loss Ratio).
Segment Profitability Overview
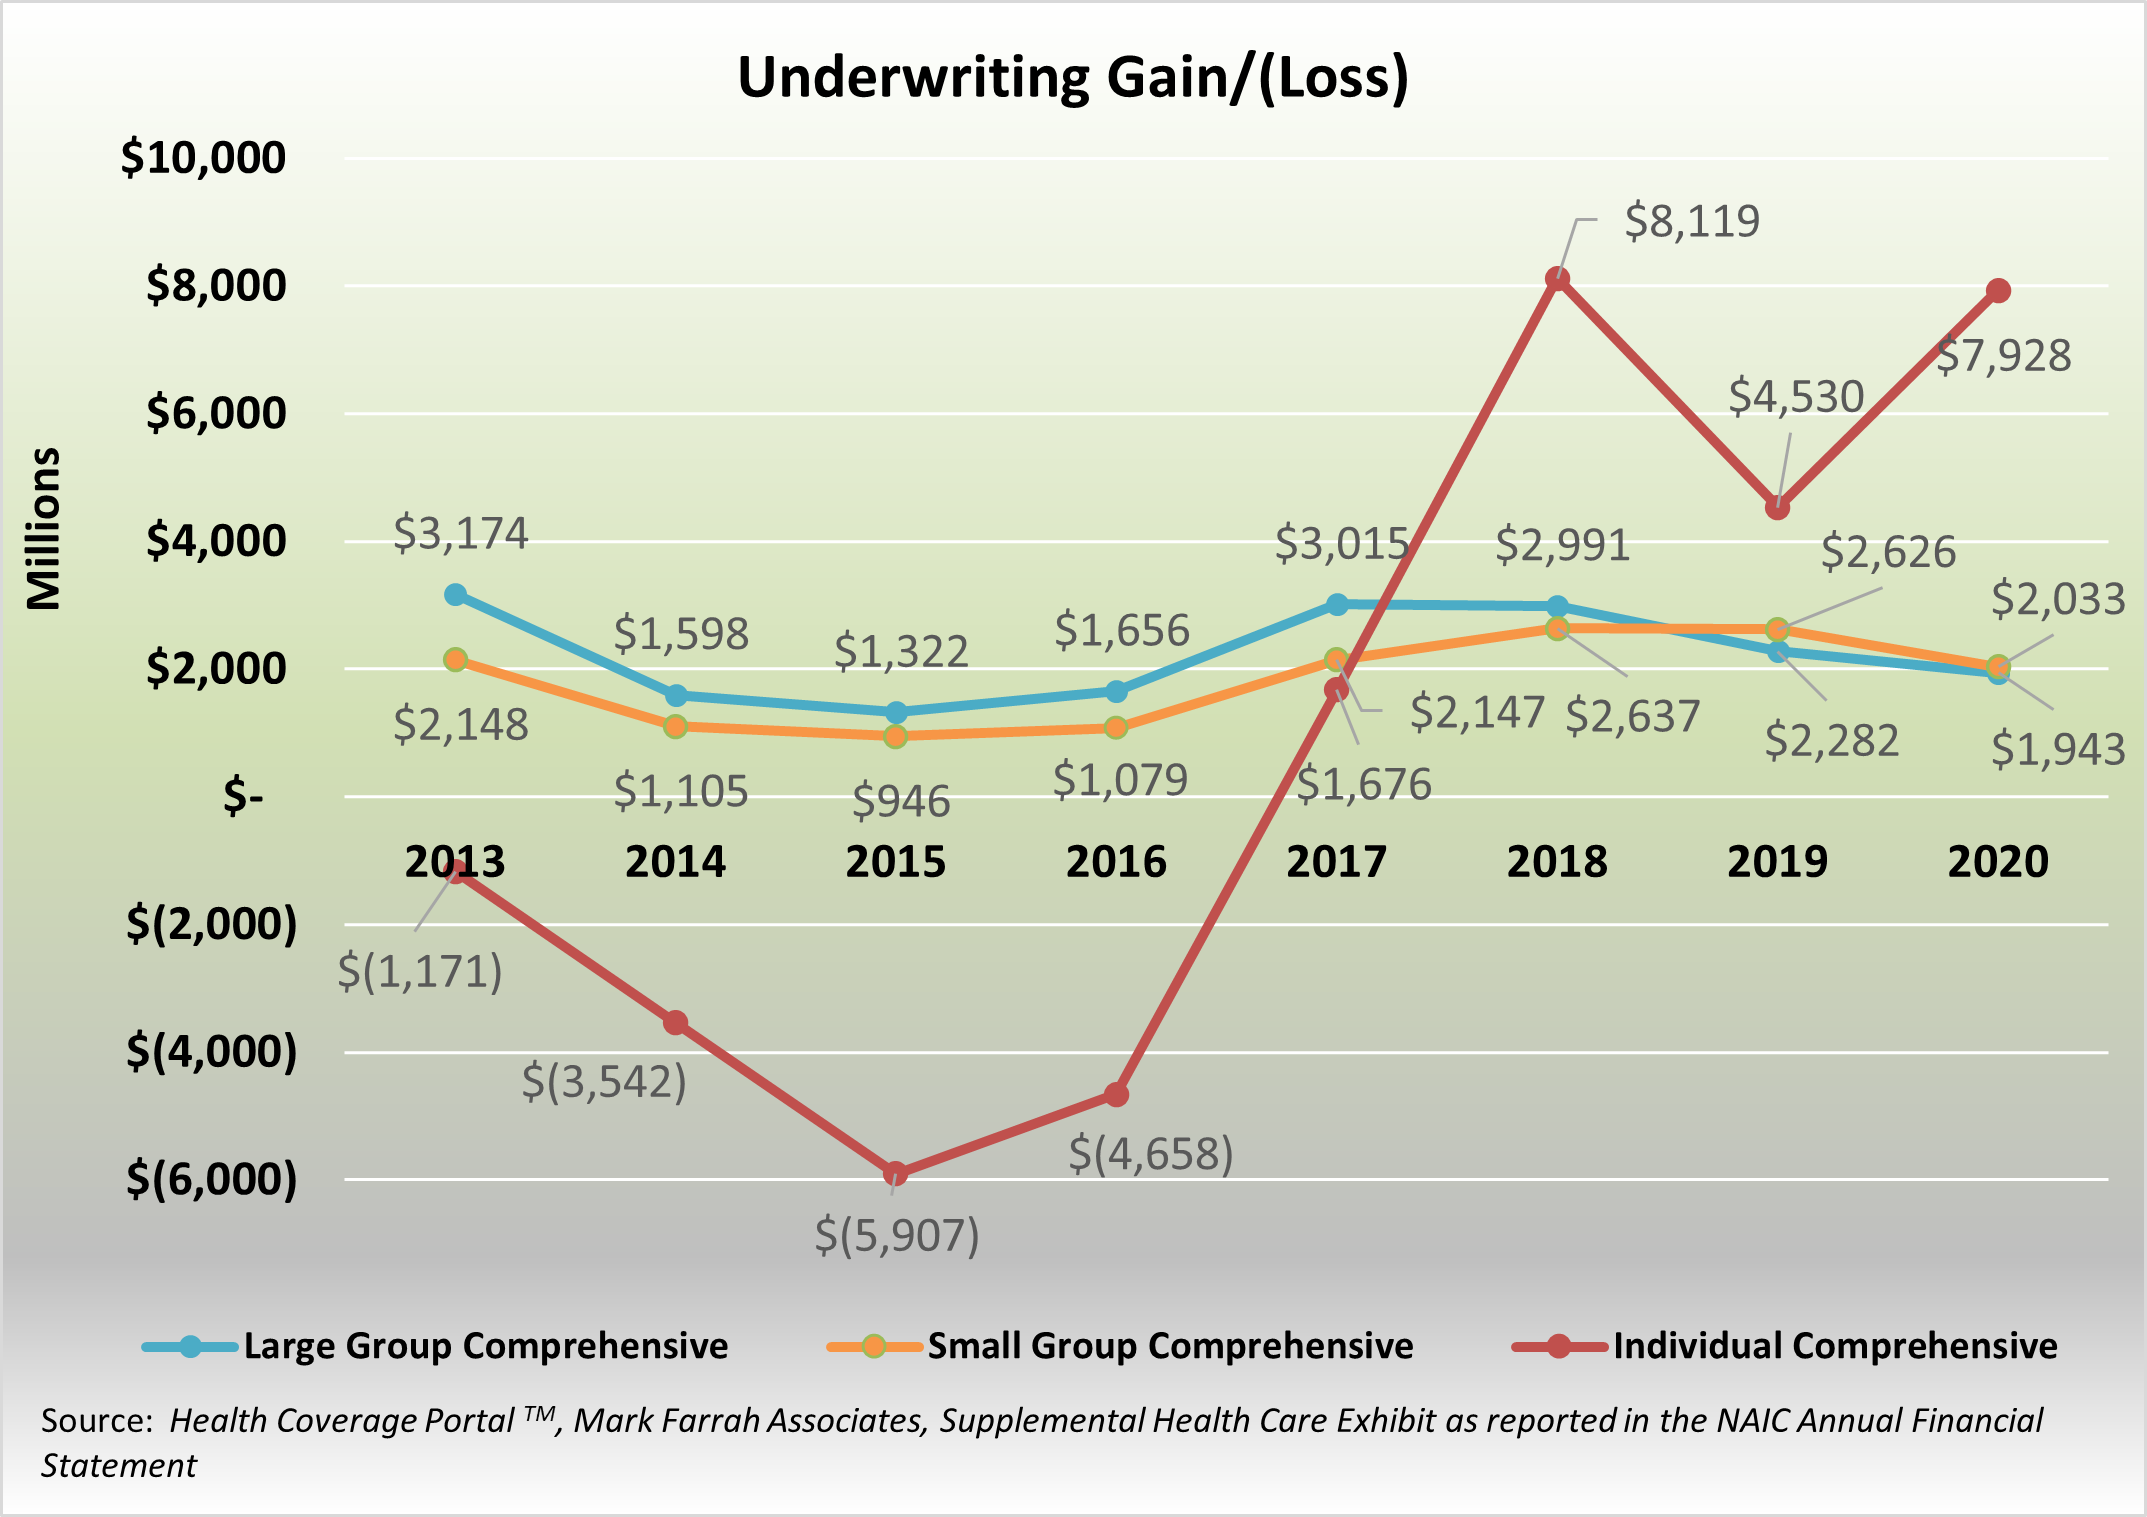
With the onset of the ACA in 2014, trend analysis starting the year before allows for a look at the ACA’s impact and course since December 2013. Beginning with the individual segment, total enrollment peaked in 2015 with nearly 14.7 million members. Current Individual segment membership stands at approximately 11.32 million members, surpassing both 2018 and 2019. While membership reached its peak in 2015, profitability for health insurance companies reached its low point with a nearly $6 billion underwriting loss. Since then, through years of premium increases which outpaced growth in medical spending, companies have now posted four consecutive years of underwriting gains for the individual segment totaling over $22 billion.
For the small group segment, membership declined every year, since the onset of the ACA, with a cumulative drop of 39.8%. While also reaching a low point in 2015, profitability has been the norm for this segment, overall. The segment has reported over $2 billion in underwriting gains for each year since 2017. However, 2020’s overall gain was down over 22% from 2019 even though segment enrollment only dropped 6%. None-the-less, for the second year in a row, the profitability for the small group segment surpassed that of the more robust large group segment. Overall, commercial risk enrollment declined another 2.6% in 2020, and over 19% since 2013. Currently standing at 54.25 million members.
Individual Comprehensive Segment
The Individual segment has sustained a four-year period of profitability, and for the first time since 2015, has experienced enrollment growth, up 6% to 11.3 million members for 2020. Premiums since 2013 have increased by 124% on a per member per month (PMPM) basis. Individual claims incurred rose by over 104.5% on a PMPM basis since 2013. While Premiums decreased 2.1%, Medical Claims also decreased by 8.5% on a PMPM basis for 2020.
Focusing on the segment leaders for this analysis, we will look at four-year trends in membership, claims incurred PMPM, adjusted premium PMPM, and their SHCE-reported MLR.
|
Individual Segment - Members |
||||
|---|---|---|---|---|
|
Company |
2017 |
2018 |
2019 |
2020 |
|
Centene |
852,961 |
1,246,117 |
1,608,117 |
1,873,188 |
|
GuideWell |
988,211 |
1,175,758 |
1,141,595 |
1,173,791 |
|
HCSC |
915,598 |
850,546 |
846,928 |
849,733 |
|
Anthem |
1,183,616 |
561,201 |
599,848 |
521,209 |
|
BCBSNC |
525,382 |
475,000 |
469,530 |
469,019 |
Source: Health Coverage Portal TM, Mark Farrah Associates, Supplemental Health Care Exhibit as reported in the NAIC Annual Financial Statement
Segment leadership is based on 2020 SHCE-reported membership by company. Centene continued its growth within the segment, reporting a 16.5% increase in individual enrollment. Anthem reported a 13.1% drop in individual enrollment for 2020 with losses in CA, GA & NH. From 2019 to 2020, the entire Individual segment grew by 637.5 thousand members.
|
Individual Segment - Incurred Claims PMPM |
||||
|---|---|---|---|---|
|
Company |
2017 |
2018 |
2019 |
2020 |
|
Centene |
$256 |
$350 |
$388 |
$397 |
|
GuideWell |
$403 |
$422 |
$480 |
$494 |
|
HCSC |
$398 |
$438 |
$536 |
$343 |
|
Anthem |
$382 |
$417 |
$437 |
$402 |
|
BCBSNC |
$419 |
$488 |
$524 |
$468 |
Source: Health Coverage Portal TM, Mark Farrah Associates, Supplemental Health Care Exhibit as reported in the NAIC Annual Financial Statement
Health insurers reported a drop in spending on medical costs for the 2020 Individual segment. This is due in part to the recognition of Risk Corridor payments from the Federal Government. These payments, from past years, were recognized by some plans in 2020 after the Supreme Court ruled in the favor of health insurers in April of 2020. Average incurred claims PMPM increased from $197 in 2013 to $404 in 2020, a 104.5% increase. However, the segment saw an 8.5% decline in claims PMPM in 2020. HCSC experienced the largest decrease, dropping to $343 PMPM in 2020 from $536 PMPM in 2019, due mainly to the recognition of almost $2 billion in Risk Corridor payments from the Federal Government.
|
Individual Segment - Adjusted Earned Premium PMPM |
||||
|---|---|---|---|---|
|
Company |
2017 |
2018 |
2019 |
2020 |
|
Centene |
$324 |
$466 |
$487 |
$481 |
|
GuideWell |
$474 |
$541 |
$601 |
$599 |
|
HCSC |
$483 |
$645 |
$623 |
$591 |
|
Anthem |
$436 |
$556 |
$561 |
$510 |
|
BCBSNC |
$538 |
$639 |
$631 |
$575 |
Source: Health Coverage Portal TM, Mark Farrah Associates, Supplemental Health Care Exhibit as reported in the NAIC Annual Financial Statement
Premiums PMPM shrunk slightly between 2019 and 2020 by 2.1%. The first year over year decrease since the onset of the ACA. Nevertheless, 2020’s premiums PMPM of $519 PMPM are 124% greater than in 2013. For 2020, Anthem reported a 9.2% decrease in premium PMPM, the largest decrease of the top 5 plans.
|
Individual Segment - Weighted Average MLR |
||||
|---|---|---|---|---|
|
Company |
2017 |
2018 |
2019 |
2020 |
|
Centene |
80.0% |
76.1% |
81.0% |
84.9% |
|
GuideWell |
85.3% |
78.7% |
80.6% |
83.7% |
|
HCSC |
82.4% |
68.5% |
86.5% |
58.8% |
|
Anthem |
88.3% |
76.1% |
79.0% |
80.3% |
|
BCBSNC |
77.8% |
76.7% |
83.4% |
81.8% |
Source: Health Coverage Portal TM, Mark Farrah Associates, Supplemental Health Care Exhibit as reported in the NAIC Annual Financial Statement
The Medical Loss Ratio (MLR) illustrates the relationship between premiums and medical costs. While premiums have decreased in 2020, medical expenses dropped even more leading to 60% of plans reporting lower MLRs for the segment in 2020. For the segment leaders, HCSC and BCBS NC experienced a drop in their average MLRs while the rest of the leaders reported higher MLRs.
It is important to note that Mark Farrah Associates is reporting all data as filed with the NAIC (National Association of Insurance Commissioners) in the annual SHCE. We are not adjusting the data to account for differences in the number of reporting plans between 2013 and 2020 nor have we adjusted for any missing plans year over year. For purposes of this analysis, MFA has calculated a weighted average MLR based upon adjusted premiums.
Small Group Comprehensive Segment
While the Small Group segment has lost considerable membership (39.8%) since 2013 with small businesses opting to either self-insure or drop health insurance coverage for their employees, overall segment profitability remains strong. Focusing on the segment leaders for this analysis, we will look at four-year trends in membership, claims incurred PMPM, adjusted premium PMPM and segment leaders’ SHCE-reported MLR.
|
Small Group Segment - Members |
||||
|---|---|---|---|---|
|
Company |
2017 |
2018 |
2019 |
2020 |
|
UnitedHealth |
2,304,117 |
2,497,280 |
2,373,118 |
1,999,126 |
|
HCSC |
1,113,402 |
1,168,945 |
1,242,755 |
1,224,119 |
|
Anthem |
864,220 |
763,153 |
655,515 |
557,571 |
|
Humana |
745,120 |
604,300 |
470,719 |
353,894 |
|
CareFirst |
377,157 |
309,682 |
317,315 |
322,789 |
Source: Health Coverage Portal TM, Mark Farrah Associates, Supplemental Health Care Exhibit as reported in the NAIC Annual Financial Statement
The five segment leaders, based on membership, include UnitedHealth, HCSC, Anthem, Humana, and CareFirst. CareFirst was the only top plan to report membership growth in 2020. Humana reported a 25% drop in small group members for 2020, UnitedHealth’s membership retreated approximately 16%, and Anthem’s membership dropped 14.9%. Overall, the segment membership was down 6% in 2020.
|
Small Group Segment - Incurred Claims PMPM |
||||
|---|---|---|---|---|
|
Company |
2017 |
2018 |
2019 |
2020 |
|
UnitedHealth |
$380 |
$399 |
$421 |
$423 |
|
HCSC |
$380 |
$407 |
$419 |
$425 |
|
Anthem |
$359 |
$392 |
$434 |
$432 |
|
Humana |
$224 |
$248 |
$309 |
$310 |
|
CareFirst |
$271 |
$364 |
$370 |
$375 |
Source: Health Coverage Portal TM, Mark Farrah Associates, Supplemental Health Care Exhibit as reported in the NAIC Annual Financial Statement
Medical costs retreated by over 6% for the small group segment, in line with the drop in enrollment. Average incurred claims PMPM increased from $292 in 2013 to $392 in 2020, a 34.4% increase. Overall, the segment saw a .9% decline in claims PMPM in 2020. Anthem was the only segment leader reporting a drop in incurred claims PMPM.
|
Small Group Segment - Adjusted Earned Premium PMPM |
||||
|---|---|---|---|---|
|
Company |
2017 |
2018 |
2019 |
2020 |
|
UnitedHealth |
$464 |
$486 |
$509 |
$501 |
|
HCSC |
$467 |
$501 |
$499 |
$494 |
|
Anthem |
$435 |
$480 |
$537 |
$555 |
|
Humana |
$279 |
$303 |
$344 |
$367 |
|
CareFirst |
$339 |
$450 |
$461 |
$479 |
Source: Health Coverage Portal TM, Mark Farrah Associates, Supplemental Health Care Exhibit as reported in the NAIC Annual Financial Statement
Average adjusted premium PMPM for the segment rose from $349 in 2013 to $472 in 2020, a 35% increase. Overall, the segment saw a 1% drop in premiums PMPM in 2020. Two of the five segment leaders reported decreases in premiums PMPM for 2020. UnitedHealth’s premium PMPM decreased 1.6% over 2019 while CareFirst’s premium PMPM increased 3.7%. Humana who has consistently reported the lowest premiums PMPM among the segment leaders, reported a 6.6% increase for 2020.
|
Small Group Segment - Weighted Average MLR |
||||
|---|---|---|---|---|
|
Company |
2017 |
2018 |
2019 |
2020 |
|
UnitedHealth |
83.0% |
82.9% |
83.6% |
85.4% |
|
HCSC |
81.9% |
82.1% |
84.6% |
86.6% |
|
Anthem |
83.7% |
83.0% |
81.9% |
79.1% |
|
Humana |
82.2% |
83.8% |
91.3% |
85.8% |
|
CareFirst |
80.7% |
81.6% |
80.7% |
79.1% |
Source: Health Coverage Portal TM, Mark Farrah Associates, Supplemental Health Care Exhibit as reported in the NAIC Annual Financial Statement
Overall, the leading plans have been able to better manage MLRs within the Small Group segment as compared to larger challenges in the Individual Segment. For 2020, most notable among the segment leaders was Humana’s 85.8% average MLR a notable decrease from 2019 due to premium increases.
Conclusion
For the Small Group and Individual segments, premium growth has stabilized, with minimal changes over 2019 which is good news for consumers. Both segments remain profitable for insurance companies overall as medical spending has stabilized and after factoring in the Individual’s segments $6B in Risk Corridor payments. The growth of enrollment in the Individual segment for 2020 is a notable development, most likely caused by the economic/employment changes brought on by COVID 19. This growth has continued through the 2nd quarter of 2021 and Mark Farrah Associates will have more to report on this trend in the coming weeks and will also continue to analyze and report on important ACA and plan performance related topics.
SCHE Data
The data used in this analysis brief was obtained from Mark Farrah Associates' Health Coverage Portal TM using Supplemental Health Care Exhibit (SHCE) data as reported in the NAIC Annual Financial Statement. Each year, MFA updates its products with the latest SHCE data. Additionally, MFA maintains financial data as well as enrollment and market share for the health insurance industry in the subscription-based Health Coverage Portal TM.
For more information about our products, refer to the product videos and brochures available on Mark Farrah Associate’s website or call 724-338-4100.
About Mark Farrah Associates (MFA)
Mark Farrah Associates (MFA) is a leading data aggregator and publisher providing health plan market data and analysis tools for the healthcare industry. Our product portfolio includes Health Coverage Portal™, County Health Coverage™, Medicare Business Online™, Medicare Benefits Analyzer™, 5500 Employer Health PLUS, and Health Plans USA™. For more information about these products, refer to the informational videos and brochures available under the Our Products section of the website or call 724-338-4100.
Healthcare Business Strategy is a FREE monthly brief that presents analysis of important issues and developments affecting healthcare business today. If you would like to be added to our email distribution list, please submit your email address to the "Subscribe to MFA Briefs" section at the bottom of this page.
Glossary
Weighted Average MLR – For analysis purposes, Mark Farrah Associates calculated average Preliminary MLR weighted on the adjusted premiums for each company by segment. The MLRs used in the calculation are average ratios based upon 2017– 2020 as reported in the NAIC’s Supplemental Health Care Exhibit.