A Brief Look at Medicare Market Share for Six Major Metro Areas
December 20, 2018
Medicare Advantage plans continue to be an attractive option for the rapidly increasing senior population. As of November 2018, total Medicare Advantage (MA) membership stood at over 21.6 million, representing approximately 34% of the 63.7 million Americans eligible for Medicare. Health plan enrollment and market share data are important metrics for health insurers to assess in order to identify opportunities and make better business decisions about products and services. Companies not only look at their own market positions but also routinely analyze competitor membership to evaluate relative market share. Industry analysts often assess market share at the county or metropolitan statistical area (MSA) level in order to gain a more complete competitive picture of the market. This brief presents an overview of Medicare market demographics and market share data, with a focus on health plan market position for six major metropolitan statistical areas (MSAs) in the U.S.
Competition and Market Share
For the purposes of this brief, MFA first looked at the competitive mix in the Medicare and Medicare Advantage markets through analysis of enrollment figures from the Health Coverage Portal™ and Medicare Business Online™ by metropolitan areas in the United States. The following table presents the major metropolitan statistical areas (MSAs) with over a million seniors currently eligible for Medicare. These 6 areas represent the largest metropolitan markets in the country for companies offering Medicare Advantage plans.
| Metropolitan Area | Medicare Eligible | Original Medicare Enrollment | Medicare Advantage Enrollment |
| as of 11/1/18 | as of 10/31/18 | as of 11/1/18 | |
| New York-Newark-Jersey City | 3,552,374 | 2,281,277 | 1,090,370 |
| Los Angeles-Long Beach-Anaheim | 2,047,525 | 983,059 | 976,559 |
| Chicago-Naperville-Elgin | 1,584,461 | 1,124,158 | 382,515 |
| Philadelphia-Camden-Wilmington | 1,172,678 | 783,908 | 329,888 |
| Miami-Fort Lauderdale-West Palm Beach | 1,150,689 | 477,777 | 615,645 |
| Dallas-Fort Worth-Arlington | 1,006,414 | 584,106 | 356,996 |
| Subtotal - Top MSAs | 10,514,141 | 6,234,285 | 3,751,973 |
| All Other MSAs | 53,168,924 | 31,631,760 | 17,854,812 |
| Total | 63,683,065 | 37,866,045 | 21,606,785 |
Source: Medicare Business Online™, Mark Farrah Associates, presenting data from CMS enrollment reports
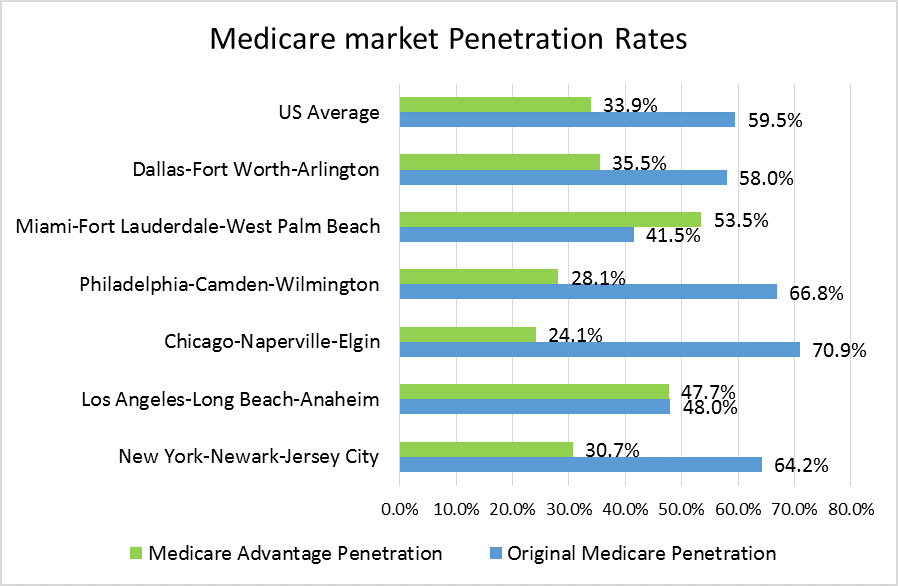
- Seniors have a choice between coverage offered by original Medicare and Medicare Advantage (MA). While potential market size is an important metric, understanding the insurance preferences of seniors requires a closer look at enrollment within each area. How seniors are behaving as consumers varies greatly among the metropolitan areas. To shed more light on these differences, Mark Farrah Associates calculated the penetration rate for original Medicare & Medicare Advantage plans. Penetration rate is calculated by dividing the number of plan members by the number of those eligible for Medicare. The penetration rate provides the overall market share which can be used to analyze seniors' choice between sticking with original Medicare and choosing a Medicare Advantage plan.
Source: Medicare Business Online™, Mark Farrah Associates, presenting data from CMS enrollment reports
- There is a greater degree of variability across the top 6 MSAs when considering original Medicare vs. Medicare Advantage penetration rates, per the chart above. The Chicago MSA has the highest original Medicare rate at just over 70.9% with the lowest Medicare Advantage penetration rate (24.1%). Similarly, Philadelphia is well below the national average with a Medicare Advantage penetration rate of 28.1%. One reason for the lower Medicare Advantage penetration in both Chicago and Philadelphia is the popularity of Medicare Supplement plans in both Illinois and Pennsylvania. On the other hand, Miami is currently sitting with only 41.5% of those eligible enrolled in original Medicare with the highest penetration rate of the 6 MSAs in the Medicare Advantage market at 53.5%. Los Angeles also records above average Medicare Advantage popularity with almost a 48% penetration rate.
| Medicare Advantage Enrollment | Medicare Advantage Market Share | |
| Top Medicare Advantage Companies | as of 11/1/18 | as of 11/1/18 |
| New York-Newark-Jersey City | ||
| UNITEDHEALTH | 378,170 | 34.7% |
| HEALTHFIRST HEALTHPLAN OF NJ | 153,387 | 14.1% |
| Los Angeles-Long Beach-Anaheim | ||
| KAISER FOUNDATION | 338,072 | 34.6% |
| UNITEDHEALTH | 143,423 | 14.7% |
| Chicago-Naperville-Elgin | ||
| HUMANA | 115,217 | 30.1% |
| UNITEDHEALTH | 103,351 | 27.0% |
| Philadelphia-Camden-Wilmington | ||
| INDEPENDENCE BLUE CROSS | 104,596 | 31.7% |
| AETNA | 88,176 | 26.7% |
| Miami-Fort Lauderdale-West Palm Beach | ||
| HUMANA | 225,273 | 36.6% |
| UNITEDHEALTH | 148,354 | 24.1% |
| Dallas-Fort Worth-Arlington | ||
| UNITEDHEALTH | 188,443 | 52.8% |
| HUMANA | 89,963 | 25.2% |
| Total | 2,076,425 |
Source: Medicare Business Online™, Mark Farrah Associates, presenting data from CMS enrollment reports
- Based on MFA’s county estimates, the above table provides the top Medicare Advantage companies and their corresponding market share in each of the top MSAs. UnitedHealth Group appears to have a strong foothold in 5 of the MSAs above, except for the Philadelphia MSA. Humana also has a large presence across the selected MSAs.
Conclusion
Eligibility, geographic location, income levels and overall health status of a population are just a few determinants of Medicare penetration in a particular area. While further demographic insight would be required to discern why Medicare and Medicare Advantage penetration is higher in some areas more than others, it is clear that the competitive mix among these MSAs indicates varying degrees of consumer choice. Nonetheless, the Medicare market continues to grow as more and more Americans of the Baby Boom generation enter retirement age. As always, Mark Farrah Associates will monitor enrollment trends and industry shifts in this highly competitive segment.
About Mark Farrah Associates (MFA)
Mark Farrah Associates (MFA) is a leading data aggregator and publisher providing health plan market data and analysis tools for the healthcare industry. MFA’s Medicare Business Online™ (MBO) product simplifies the tracking of monthly Medicare Advantage and PDP enrollment by competitor. The Medicare Benefits Analyzer™ presents benefit copay comparisons across hundreds of benefit attributes by plan as reported in the Plan Finder on Medicare.gov. Med Supp Market Data™ offers enrollment and financial insights for companies interested in Medicare Supplement business. Our product portfolio also includes Health Coverage Portal™ (with Supplemental Health Care Exhibit data), County Health Coverage™, and Health Plans USA™.
Healthcare Business Strategy is a FREE monthly brief that presents analysis of important issues and developments affecting healthcare business today. If you would like to be added to our email distribution list, please submit your email to the "Subscribe to MFA Briefs" section in the gray area at the bottom of the page.