A Brief Analysis of the Medicare Market in Six Major Metro Areas
Total current Medicare Advantage (MA) membership is nearly 23.3 million, representing approximately 35% of the 67.2 million Americans eligible for Medicare. As seniors increasingly enroll in MA plans, health plan enrollment and market share data have become even more important metrics for health insurers to assess. Companies not only consider their own market positions but also routinely analyze competitor membership to evaluate relative market share. Market share at the county or metropolitan statistical area (MSA) level is often assessed to gain a more complete competitive picture of the market. This brief presents an overview of Medicare market demographics and market share data, with a focus on health plan market position for six major metropolitan statistical areas in the United States.
Competition and Market Share
Mark Farrah Associates (MFA) analyzed Medicare and Medicare Advantage market enrollment figures from the Health Coverage Portal™ and Medicare Business Online™ by major metropolitan area in the United States. Medicare eligibility is presented in the following table for the major MSAs with over a million seniors currently eligible for Medicare. These 6 areas represent the largest metropolitan markets in the country for companies offering Medicare Advantage plans.
| Metropolitan Area | Medicare Eligible | Original Medicare Enrollment | Original Medicare Penetration | Medicare Advantage Enrollment | Medicare Advantage Penetration |
| as of 11/1/19 | as of 10/31/19 | as of 11/1/19 | |||
| New York-Newark-Jersey City | 3,579,434 | 2,151,006 | 60.1% | 1,175,617 | 32.8% |
| Los Angeles-Long Beach-Anaheim | 2,129,666 | 985,261 | 46.3% | 1,025,468 | 48.2% |
| Chicago-Naperville-Elgin | 1,651,324 | 1,119,195 | 67.8% | 422,299 | 25.6% |
| Philadelphia-Camden-Wilmington | 1,221,598 | 773,740 | 63.3% | 366,673 | 30.0% |
| Miami-Fort Lauderdale-West Palm Beach | 1,207,461 | 473,794 | 39.2% | 649,189 | 53.8% |
| Dallas-Fort Worth-Arlington | 1,052,588 | 580,621 | 55.2% | 379,083 | 36.0% |
| Subtotal - Top MSAs | 10,842,071 | 6,083,617 | 56.1% | 4,018,329 | 37.1% |
| All Other MSAs | 43,866,662 | 24,155,853 | 55.1% | 16,303,781 | 37.2% |
| Total | 54,708,733 | 30,239,470 | 55.3% | 20,322,110 | 37.1% |
Source: Medicare Business Online™, Mark Farrah Associates, presenting data from CMS enrollment reports
In addition to market size represented above, market share can be used to analyze insurance preferences between original Medicare and MA plans. Senior plan choices vary due to a wide array of reasons and concerns. However, senior behavior can be analyzed utilizing penetration rates at a regional level. MFA calculated the penetration rate for original Medicare & MA plans by dividing enrollees by the number of those eligible for Medicare.
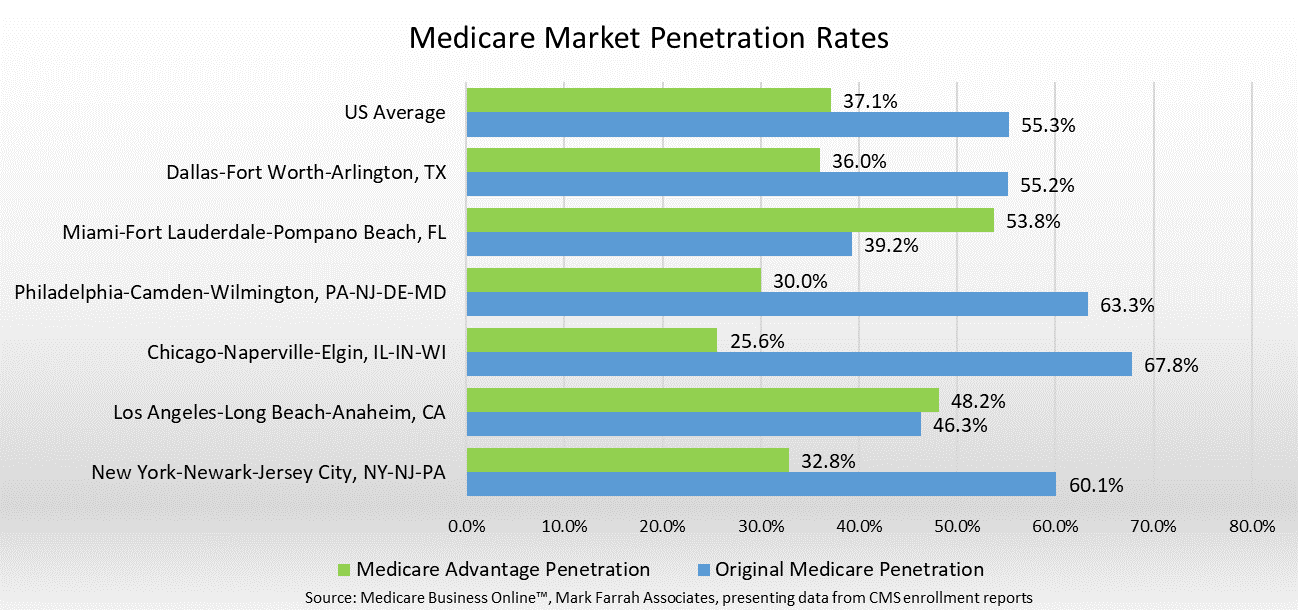
As shown above, original Medicare and MA penetration rates vary across the top 6 MSAs. Miami had the highest penetration rate of the 6 MSAs in the MA market at 53.8% and the lowest original Medicare penetration rate at 39.2%. Los Angeles also noted above average MA rates at 48.2%. The Chicago MSA has the highest original Medicare rate among the 6 MSAs at 67.8% with the lowest MA penetration rate (25.6%). One reason for the lower MA penetration in Chicago is the popularity of Medicare Supplement plans in Illinois.
| Medicare Advantage Enrollment | Medicare Advantage Market Share | |
| Top Medicare Advantage Companies | as of 11/1/19 | as of 11/1/19 |
| New York-Newark-Jersey City | ||
| UNITEDHEALTH GRP | 372,149 | 31.7% |
| CVS GRP | 241,149 | 20.5% |
| Los Angeles-Long Beach-Anaheim | ||
| KAISER FOUNDATION | 348,289 | 34.0% |
| UNITEDHEALTH GRP | 144,125 | 14.1% |
| Chicago-Naperville-Elgin | ||
| HUMANA GRP | 131,511 | 31.1% |
| UNITEDHEALTH GRP | 112,600 | 26.7% |
| Philadelphia-Camden-Wilmington | ||
| CVS GRP | 117,618 | 32.1% |
| INDEPENDENCE BLUE CROSS | 105,876 | 28.9% |
| Miami-Fort Lauderdale-West Palm Beach | ||
| HUMANA GROUP | 237,260 | 36.5% |
| UNITEDHEALTH GRP | 150,876 | 23.2% |
| Dallas-Fort Worth-Arlington | ||
| UNITEDHEALTH GRP | 191,412 | 50.5% |
| HUMANA GRP | 101,993 | 26.9% |
Source: Medicare Business Online™, Mark Farrah Associates, presenting data from CMS enrollment reports
The above table provides the top MA companies and their corresponding market share in each of the top MSAs, based upon MFA’s county estimates. UnitedHealth Group continues to have a strong presence in 5 of the MSAs above, apart from the Philadelphia MSA. Humana also has a large membership count across the selected MSAs.
About Mark Farrah Associates (MFA)
Mark Farrah Associates (MFA) is a leading data aggregator and publisher providing health plan market data and analysis tools for the healthcare industry. MFA’s Medicare Business Online™ (MBO) product simplifies the tracking of monthly Medicare Advantage and PDP enrollment by competitor. The Medicare Benefits Analyzer™ presents benefit copay comparisons across hundreds of benefit attributes by plan as reported in the Plan Finder on Medicare.gov. Med Supp Market Data™ offers enrollment and financial insights for companies interested in Medicare Supplement business. Our product portfolio also includes Health Coverage Portal™ (with Supplemental Health Care Exhibit data), County Health Coverage™, and Health Plans USA™.
Healthcare Business Strategy is a FREE monthly brief that presents analysis of important issues and developments affecting healthcare business today. If you would like to be added to our email distribution list, please submit your email to the "Subscribe to MFA Briefs" section in the gray area at the bottom of the page.