A Brief Analysis of Year-Over-Year Medicare Advantage and PDP Enrollment Trends
March 31, 2020
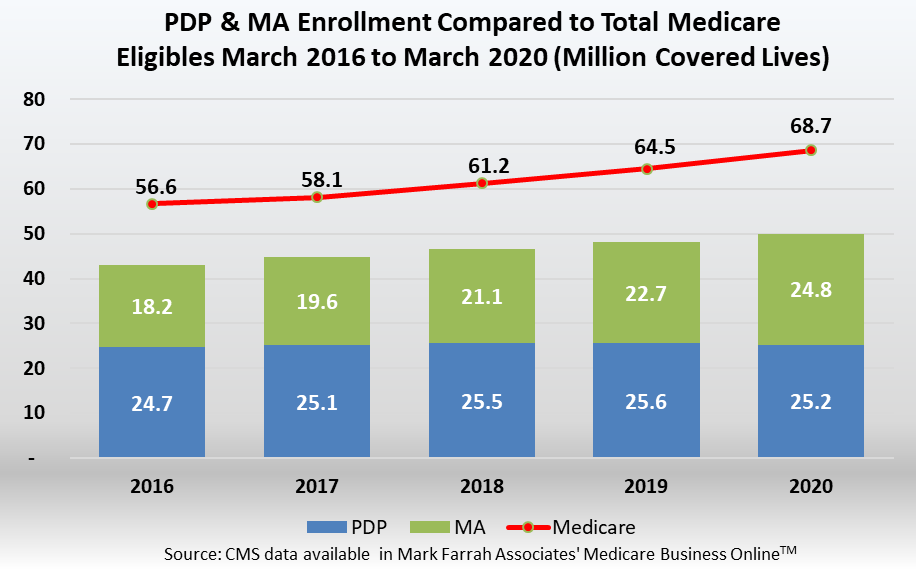
As of March 1, 2020, total Medicare Advantage (MA), including Medicare Advantage with Prescription Drug Plan (MA-PD) membership, stood at 24,750,719 with a net gain of 2,096,443 members from March 1, 2019. Medicare stand-alone prescription drug plans (PDPs) covered 25,194,944 members as of March 1, 2020, a net decrease of 364,857 from the previous year. This brief assesses Medicare Advantage and PDP performance, market share and market penetration by state as of March 1, 2020.
Medicare Advantage Membership
Medicare Advantage (MA) market penetration remains strong; however, there is still abundant opportunity for growth with only 36% of the 68.6 million people eligible for Medicare. According to CMS Medicare Advantage enrollment reports aggregated by MFA in Medicare Business Online™, total Medicare Advantage plan enrollment as of March 1, 2020 increased 9.3% from March 2019. The top ten companies, each with more than 150,000 members in this segment, collectively provide coverage for 75.5% of the market. Per the reference tables below, most leading MA companies realized year-over-year growth with the exception of Centene. The overall net gain for the ten companies was over 10%.
MA Leading Plan Performance
UnitedHealth continues to dominate in this highly competitive segment. With approximately 6.35 million enrolled, UnitedHealth commands 25.7% of the Medicare Advantage market. Humana ranks second with 18% market share and nearly 4.46 million lives. CVS maintains the third position, enrolling over 2.6 million, and Kaiser Foundation Group follows with over 1.68 million lives.
|
March 2020 Top 10 MA Organizations |
||||
|
Parent |
Mar-19 |
Mar-20 |
Percent Growth |
March 2020 Market Share |
|
UNITEDHEALTH |
5,843,132 |
6,351,706 |
8.7% |
25.7% |
|
HUMANA |
3,960,480 |
4,457,735 |
12.6% |
18.0% |
|
CVS |
2,255,535 |
2,612,689 |
15.8% |
10.6% |
|
KAISER |
1,633,597 |
1,681,235 |
2.9% |
6.8% |
|
ANTHEM |
1,129,799 |
1,326,252 |
17.4% |
5.4% |
|
BCBS OF MI |
520,824 |
591,631 |
13.6% |
2.4% |
|
WELLCARE |
553,932 |
586,089 |
5.8% |
2.4% |
|
CIGNA |
442,745 |
508,825 |
14.9% |
2.1% |
|
CENTENE |
306,291 |
290,501 |
-5.2% |
1.2% |
|
HIGHMARK |
279,762 |
285,142 |
1.9% |
1.2% |
|
Subtotal Top 10 |
16,926,097 |
18,691,805 |
10.4% |
75.5% |
|
All Others |
5,728,179 |
6,058,914 |
5.8% |
24.5% |
|
Total |
22,654,276 |
24,750,719 |
9.3% |
100.0% |
Source: Medicare Business Online, Mark Farrah Associates, presenting data from CMS enrollment reports |
||||
The chart below indicates membership gains were considerable for the leaders in this segment. UnitedHealth’s growth continues to raise the bar for MA plan competition. UnitedHealth reported the largest increase in membership, adding over 508,000 members year-over-year, for a net gain of 8.7%. Humana experienced the second largest gains with over 497,000 new members. CVS and Anthem gained over 357,000 and 196,000 new members, respectively.
|
MA Organizations with the Largest Gains from March 2019 to March 2020 |
||||
|
Parent |
Mar-19 |
Mar-20 |
Growth 2019-2020 |
Percent Change |
|
UNITEDHEALTH |
5,843,132 |
6,351,706 |
508,574 |
8.7% |
|
HUMANA |
3,960,480 |
4,457,735 |
497,255 |
12.6% |
|
CVS |
2,255,535 |
2,612,689 |
357,154 |
15.8% |
|
ANTHEM |
1,129,799 |
1,326,252 |
196,453 |
17.4% |
|
BCBS OF MI |
520,824 |
591,631 |
70,807 |
13.6% |
|
CIGNA |
442,745 |
508,825 |
66,080 |
14.9% |
|
KAISER |
1,633,597 |
1,681,235 |
47,638 |
2.9% |
|
WELLCARE |
553,932 |
586,089 |
32,157 |
5.8% |
|
HEALTHFIRST |
161,653 |
192,150 |
30,497 |
18.9% |
|
SPECTRUM HEALTH |
151,718 |
177,990 |
26,272 |
17.3% |
|
Total |
16,653,415 |
18,486,302 |
1,832,887 |
11.0% |
Source: Medicare Business Online, Mark Farrah Associates, presenting data from CMS enrollment reports |
||||
MA Individual and Group Enrollment
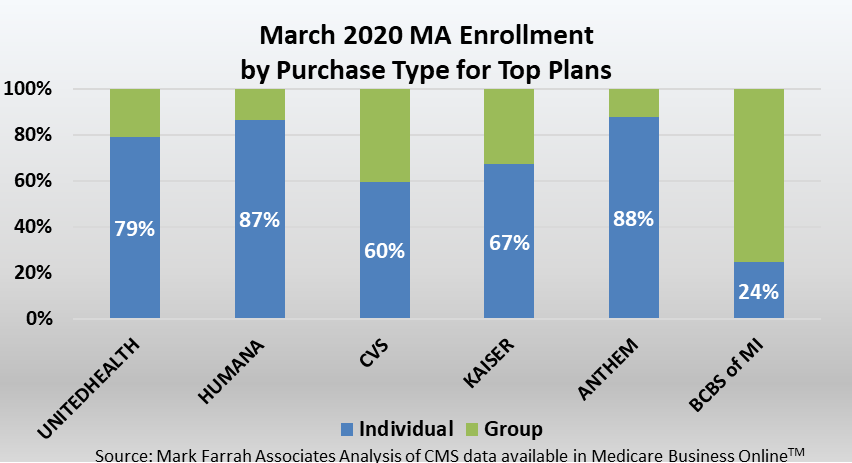
As of March 1, 2020, 81% of membership was from individual MA policies with approximately 19.8 million enrolled lives. UnitedHealth Group leads in this sector with nearly 5 million members enrolled in individual MA plans. In contrast to direct purchase policies, approximately 4.7 million members originated through an employer group health plan or retirement health benefit as of March 2020. Enrollment in group MA plans continues to grow as these plans allow employers to provide comprehensive medical coverage and quality plan design at lower costs to senior citizens. Group membership increased by 216,000 members as compared to the same time period a year ago. Enrollment was primarily driven by UnitedHealth Group with the company’s total employer-group membership at over 1.32 million. CVS's group MA membership stood at 1.04 million, comprising 22% of group enrollment as of March 1, 2020. Humana and Kaiser Foundation Group continued to have more than 550,000 members from group plans.
It is important to note that MA enrollment counts by company or geography for the same reporting period may be slightly different, depending on the CMS enrollment source. CMS county-level reports do not output enrollment for plans with 10 or fewer members per county. There may likely be additional competitive shifts in enrollment and market observations through March.
MA Plan Types
HMOs, including those with point-of-service options, remain the dominant plan type. As of March 1, 2020, 14.7 million of all MA members were enrolled in an HMO plan. PPOs, including local and regional plans, covered approximately 9 million MA enrollees. Enrollment for the Dual eligible population, or Medicare-Medicaid Plans (MMPs), stood at over 378,000 as CMS and state Medicaid agencies continue to build new programs. Private-fee-for-service (PFFS) and "Other" plan types, including Cost or Medical Savings options, comprised 1.3% of all MA members.
MA Enrollment Growth by State
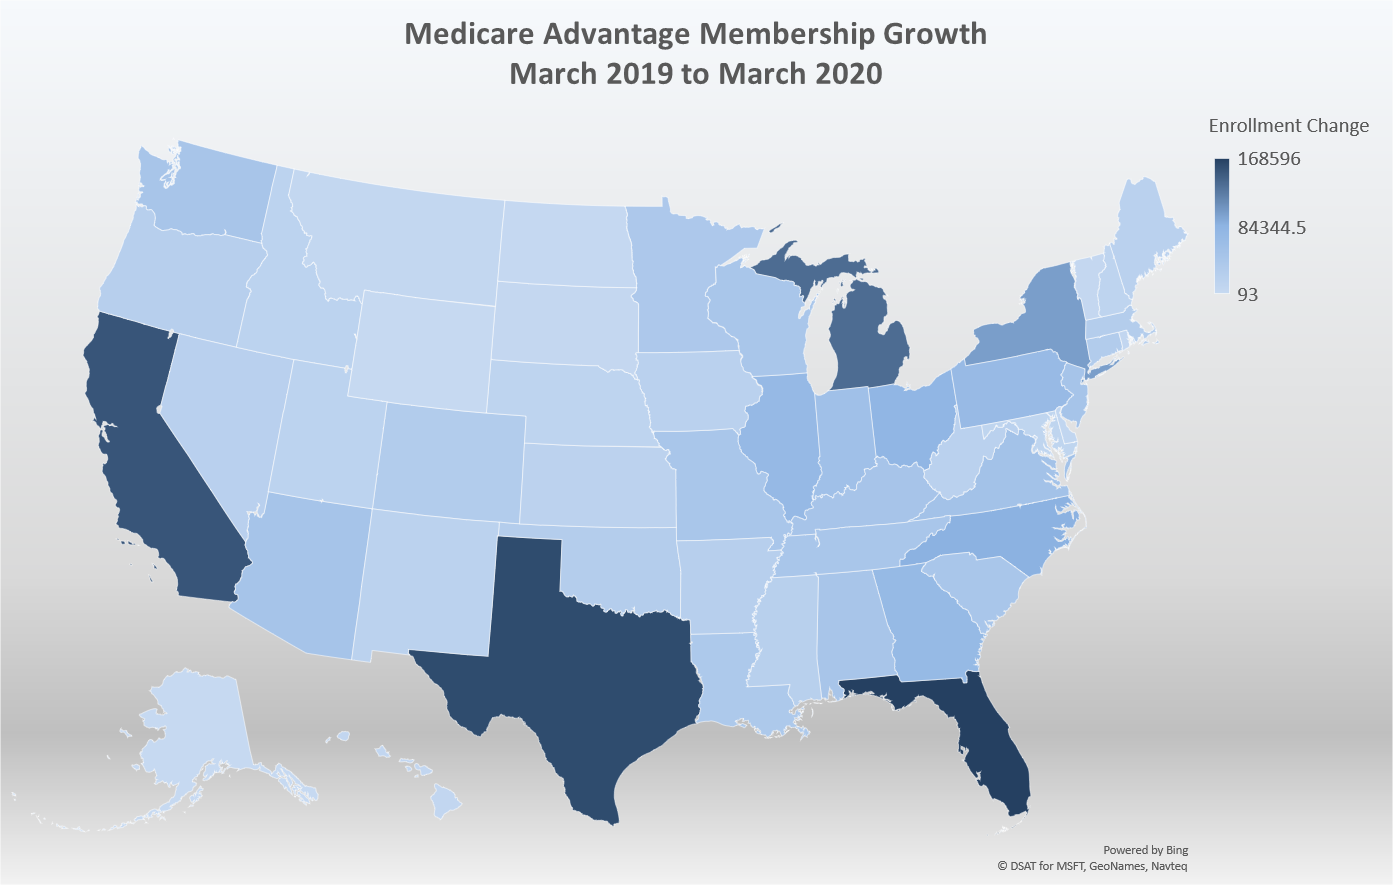
As of March 1, 2020, Medicare Advantage enrollment increased in all contiguous states. Overall, a net membership gain of approximately 2.1 million was seen nationally. Florida, Texas, California, Michigan, and New York all experienced significant enrollment gains with increases of 100,000 members or more. Florida experienced the most sizeable year-over-year increase of nearly 169,000 members.
Stand-alone Prescription Drug Plan Enrollment
Stand-alone prescription drug plans (PDPs), also referred to as Medicare Part D stand-alone plans, enrolled nearly 25.2 million people as of March 1, 2020, a decrease of 364,857 enrollees from March 2019. PDP plans provide prescription drug coverage for nearly 37% of the 68.7 million people eligible for Medicare. Enrollment in products sold to individuals was 20,243,444 in March 2020, a decrease of 330,467, year-over-year. Only 4.56 million Medicare beneficiaries were enrolled in employer group PDPs as of March 1, 2020, a decline of approximately 19,000 members since March 2019. It is important to note this assessment is reporting on Stand-alone PDP members only, and Medicare Advantage with prescription drug plan (MA-PD) members are not included in this analysis.
PDP Leading Plan Performance
There are currently 48 organizations competing in Medicare stand-alone prescription drug plans (PDPs) as of March 2020. Six companies have greater than 800,000 members and command 91% of the PDP market. Five of these plans control 87% of the market covering 2 million members or more. Per the chart below, CVS Group covers the largest number of people in PDPs; however, CVS saw a 33.3% decrease in enrollment between March 2019 and March 2020 after selling Aetna’s PDP business to WellCare in 2019. Consequently, WellCare experienced the most sizable percentage of year-over-year enrollment growth with a 171.6% membership gain.
|
March 2020 Top PDP Organizations |
||||
|
Parent |
Mar-19 |
Mar-20 |
Percent Growth |
March 2020 Market Share |
|
CVS |
8,519,821 |
5,681,399 |
-33.3% |
22.5% |
|
UNITEDHEALTH |
5,159,930 |
4,847,038 |
-6.1% |
19.2% |
|
WELLCARE |
1,626,264 |
4,416,776 |
171.6% |
17.5% |
|
HUMANA |
4,339,785 |
3,779,400 |
-12.9% |
15.0% |
|
CIGNA |
3,308,955 |
3,303,491 |
-0.2% |
13.1% |
|
ENVISION INS |
634,499 |
879,524 |
38.6% |
3.5% |
|
Subtotal |
23,589,254 |
22,907,628 |
-2.9% |
90.9% |
|
All Others |
1,970,547 |
2,287,316 |
16.1% |
9.1% |
|
Total |
25,559,801 |
25,194,944 |
-1.4% |
100.0% |
Source: Medicare Business Online, Mark Farrah Associates, presenting data from CMS enrollment reports |
||||
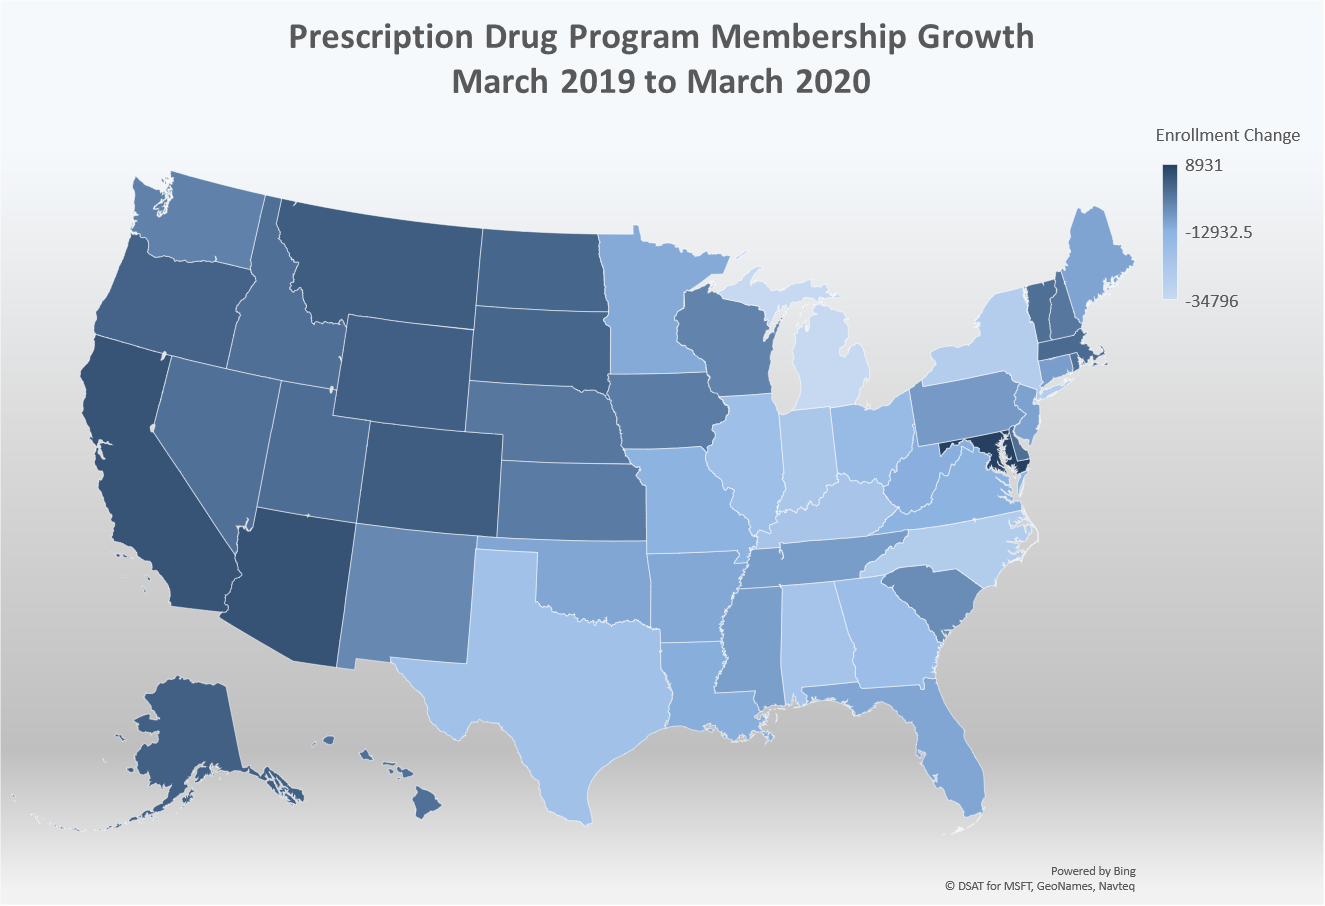
PDP Market Penetration by State
Stand-alone prescription drug plan enrollment experienced a decrease in 36 states within the contiguous U.S. including the District of Columbia as of March 1, 2020. Michigan had the largest year-over-year aggregate decrease with over 34,000 fewer enrollees in this segment. Maryland, with 547,267 members saw the most sizeable increase of 8,931 more PDP enrollees from the previous year. Arizona experienced the second highest enrollment gains with an increase of 5,385 members.
Conclusion
Health insurers continue to invest in MA and PDP growth opportunities for increased enrollment, revenue and profits as the number of people entering retirement increases each year. The Annual Election Period (AEP) for Medicare Advantage (MA) and prescription drug plans (PDPs) runs from October 15th through December 7th each year. Health insurers compete by offering new pricing and product options to beneficiaries during the AEP. Plans then begin to analyze final enrollment results in February and March to evaluate their standing and assess which competitors gained and lost members during the last AEP. Many companies conduct their post-AEP competitive assessments by using tools such as Mark Farrah Associates’ (MFA) Medicare Business Online™ and Health Coverage Portal™. Mark Farrah Associates will continue to monitor plan performance in this highly competitive Medicare segment.
About this Data
This brief is based on an analysis of enrollment data for Medicare Advantage and Prescription Drug Plans (PDPs) released by the Centers for Medicare & Medicaid Services (CMS). Mark Farrah Associates’ Medicare Business Online™ simplifies the tracking of monthly Medicare Advantage and PDP enrollment by competitor. Enrollment data is updated monthly as soon as CMS releases new data. In addition to MFA’s Medicare Business Online™, using MFA’s Medicare Benefits Analyzer, health companies can compare and analyze 2020 benefit packages and develop strategies to offer 2021 products that will attract seniors while ensuring the company is not adversely selected.
About Mark Farrah Associates (MFA)
Mark Farrah Associates (MFA) is a leading data aggregator and publisher providing health plan market data and analysis tools for the healthcare industry. Our product portfolio includes Health Coverage Portal™, County Health Coverage™, Medicare Business Online™, Medicare Benefits Analyzer™, and Health Plans USA™. For more information about these products, refer to the informational videos and brochures available under the Our Products section of the website or call 724-338-4100.
Healthcare Business Strategy is a FREE monthly brief that presents analysis of important issues and developments affecting healthcare business today. If you would like to be added to our email distribution list, please submit your email address to the "Subscribe to MFA Briefs" section at the bottom of this page.