A Brief Analysis of Private Sector Health Insurance Business
June 22, 2022
Large, private-sector employers, i.e., companies not owned or operated by the government, have long been an attractive target for health insurance business. There are approximately 123,000 large firms in the private sector, employing anywhere from 100 to upwards of more than 1,000 employees, per the U.S. Bureau of Labor Statistics. The majority offer health and welfare benefits that provide medical, dental, and vision coverage, as well as life and disability benefits for their employees. Large private-sector employers providing health and welfare benefit plans subject to ERISA [1] are required to file the annual Form 5500 with the Internal Revenue Service. Form 5500 is a primary source of employer information about health and welfare benefits, as well as pension plans. This brief presents a high-level overview of health benefit insights gleaned from MFA’s 5500 Employer Health Plus product. These observations are based on 79,287 employers that indicated they had active health benefit contracts as of their most recent filings.
Health Benefit Contracts by Participant Pool
A total of 79,287 private-sector employers reported in their most recent filing that they offer some type of health benefit (other than vision or dental) that is subject to ERISA guidelines. As reported, these companies collectively make health benefits available to a universe of about 83.3 million participants. It is important to note that “participants,” per Form 5500 instructions, is defined as the annual count of active and former employees who are eligible for coverage, but not necessarily enrolled. Furthermore, this field is representative of participants across all health and welfare benefits reported by plan employer sponsors, not just health. Nonetheless, this measure provides a general indication of the potential size of health and welfare benefit contracts by employer.
The following table presents private-sector employers that reported more than 500,000 potential plan participants across the spectrum of all health benefit contracts. The top-ranking employer/sponsor is the NEA (National Education Association) Retiree Health Plan. The NEA is a professional organization representing teachers and other personnel employed by public schools nationwide. The second largest is the retail superstore company Walmart. The third largest is the International Brotherhood of Teamsters, a large labor union representing a diverse membership of professional and non-professional workers across many industries. Other top employer/sponsors include Amazon, Target, and AT&T.
|
Largest Private Sector Employer Health Benefit Contracts |
|
|
Employer / Sponsor |
Participants |
|
NEA RETIREE HEALTH PLAN |
2,731,976 |
|
WALMART, INC. |
1,847,066 |
|
TRUSTEES OF INTL TEAMSTERS VOLUNTARY |
1,701,139 |
|
AMERICAN FEDERATION OF TEACHERS BENEFIT TRUST |
1,200,539 |
|
AMAZON.COM SERVICES, LLC |
956,498 |
|
TARGET CORPORATION |
902,681 |
|
AT&T INC. |
835,033 |
|
FEDEX CORPORATION |
755,774 |
Source: Mark Farrah Associates' 5500 Employer Health Plus |
|
As a reminder, Form 5500 definitions and reporting instructions pertaining to health benefits are broad and data are not necessarily indicative of comprehensive medical coverage. For example, a closer look at Amazon’s filings found several health insurers under contract, with Metropolitan Life Insurance providing health coverage for almost 245,000 enrollees. On the other hand, contracts for the largest number of enrolled within the NEA Retiree Health Plan were for life insurance provided by Prudential Insurance Company. Due to filing guidelines and companies with different fiscal year ends, this subset of data generally encompasses filings from 2020 with a smaller amount from 2019 and 2021 to reflect the most recent filings available.
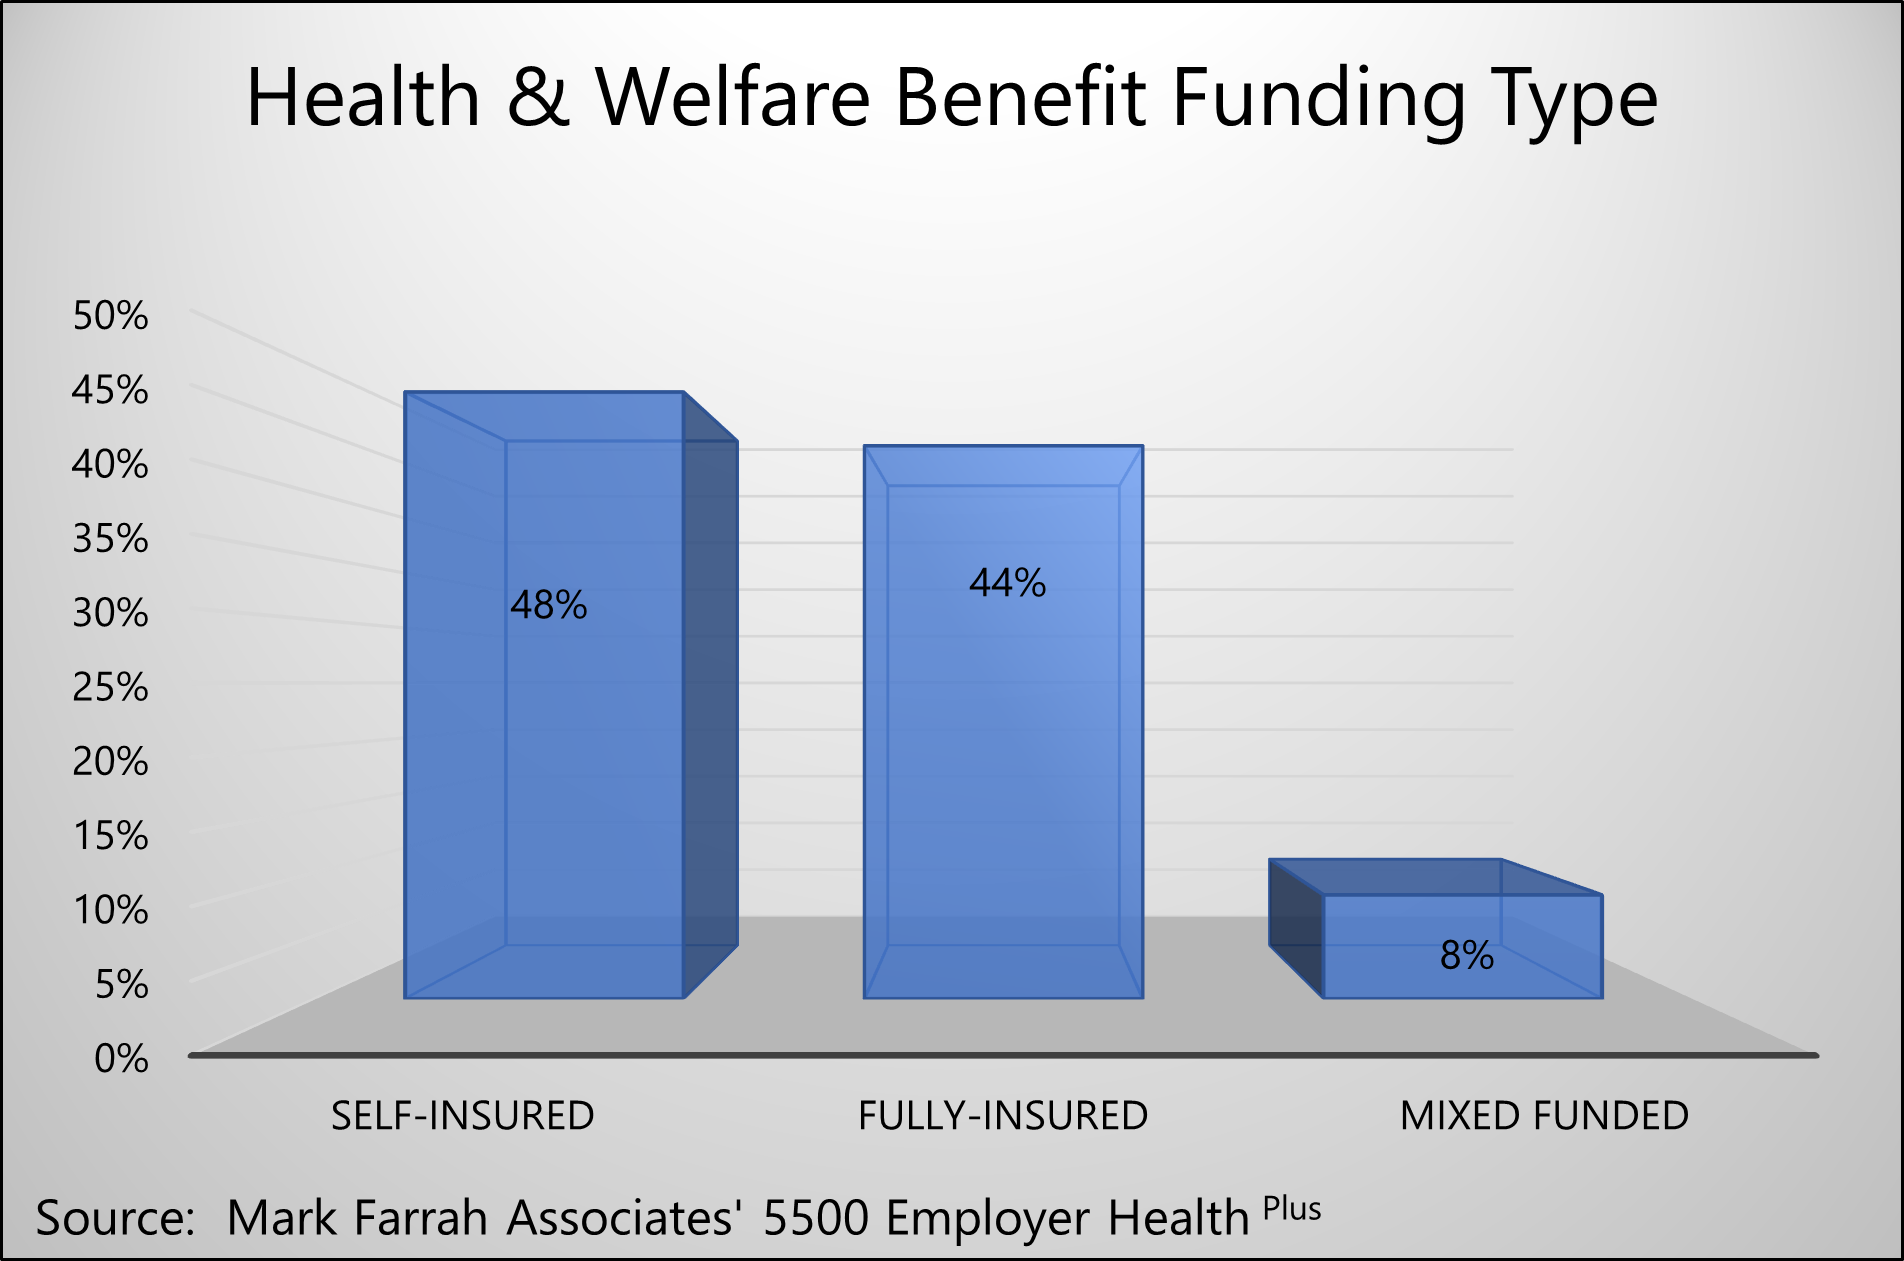
At the individual employer/sponsor filing level, the 5500 Employer Health Plus database includes useful observations about plan funding type based on MFA-calculated estimates. An assessment of most recent filings found just under half of all benefit funding arrangements (44%) that included health benefits were fully-insured plans. Forty-eight percent of plans assessed were self-insured while the remaining 8% were mixed funding arrangements. Large health insurers generally offer plans across all funding types. Depending upon an insurer’s market strategy, one might pursue growth by targeting employers that prefer one funding type over another.
Within the Form 5500, Schedules A and C provide important insights about insurance carriers that private sector employers have contracted with for health, welfare benefits, and related services. Please note that these general descriptions of schedules used for reporting of benefit plan details in Form 5500 are intended to provide a broad understanding for the purposes of general market analysis. Refer to the filing instructions and/or consult with an employee benefits expert for in-depth guidance.
Schedule A Observations
Insurance carrier business was analyzed using Schedule A [2] and utilized data for only benefit contract types of health, HMO, and PPO. To provide a high-level overview of the market, the number of insured and total premiums paid were aggregated at the parent company level (Insurer Group) for each health plan/insurance carrier record. The Insured field represents the estimated number of persons covered at the end of the policy year, a field synonymous with covered lives or number of enrolled. The # Filings variable represents the number of filings in which each Insurer Group was reported, generally the same as number of contracts. Total Premiums in the table below are the sum of premiums paid for experience-rated and non-experience-rated contracts.
Kaiser ranked highest with an aggregate total of 4.1 million insured across 10,458 contracts. UnitedHealth ranked second, reporting more than 3.9 million aggregate insured or covered lives. CIGNA, Metropolitan, and CVS were also in the top five insurers. As a reminder, it is important to note that Form 5500 definitions and reporting instructions pertaining to health benefits are broad and data are not necessarily indicative of comprehensive medical coverage.
|
Top Five: Largest Insurer Groups by Insured |
|||
|
Insurer Group |
# Filings |
Insured |
Total Premiums |
|
KAISER FOUNDATION GRP |
10,458 |
4,130,325 |
$24,427,205,615 |
|
UNITEDHEALTH GRP |
6,953 |
3,959,082 |
$18,015,468,997 |
|
CIGNA HLTH GRP |
6,245 |
3,839,305 |
$11,750,193,810 |
|
METROPOLITAN GRP |
1,719 |
3,264,304 |
$535,213,281 |
|
CVS GRP |
4,250 |
2,798,112 |
$10,348,058,542 |
Source: Mark Farrah Associates' 5500 Employer Health Plus |
|||
UnitedHealth’s largest accounts, based on most recent filings, was Insperity Holdings, a PEO (professional employer organization) that sponsors health and other employee benefits for many employer groups. One of the largest accounts for both CVS Group and Metropolitan Group was ADP Totalsource, Inc., also a PEO type company.
Schedule C Observations
An analysis of Schedule C [3] data provided the following insights about insurance carrier compensation for administration of various types of self-insured benefit plans. Although MFA’s data logic strives to eliminate filings that are primarily pension plan purposed, Schedule C does not include reporting of benefit contract types. Therefore, the compensation insights should be interpreted broadly as fees paid for contracts that may include health benefits.
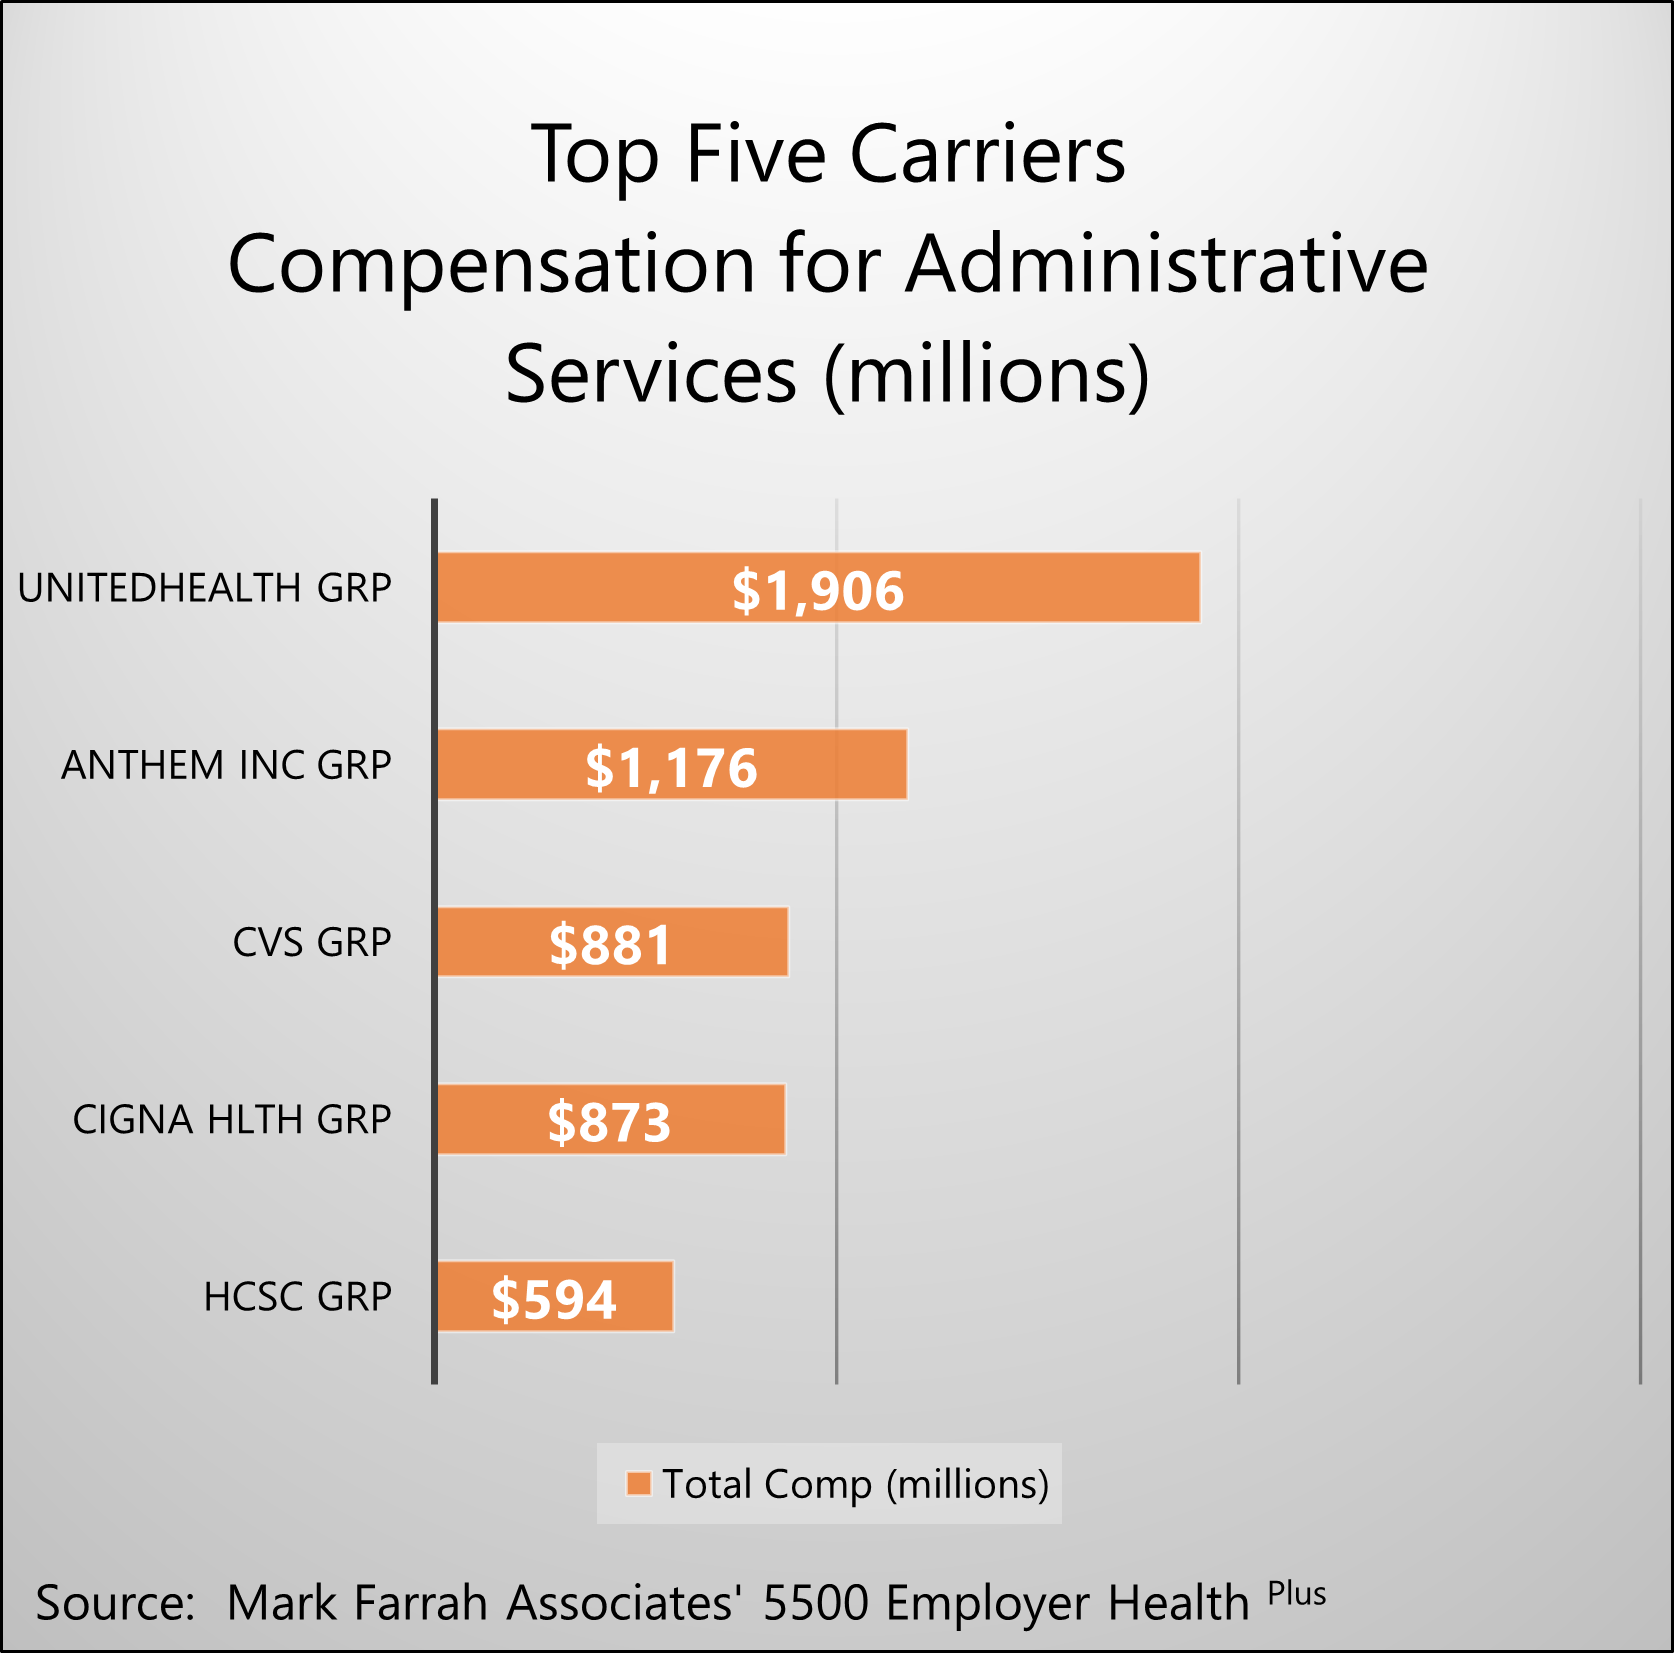
UnitedHealth plans received more than $1.9 billion in compensation for providing third party administrative services pertaining to health and welfare benefit contracts with private sector employers. Form 5500 filings show Wells Fargo, Nissan North America, and Delta Airlines were among UnitedHealth’s top employers relative to compensation paid for administrative services. Anthem, CVS, CIGNA, and HCSC round out the top five carriers based on compensation for administering self-insured plans.
Note: With respect to the designation of Insured Groups as parent companies, MFA makes every effort to accurately aggregate carriers by group but cannot guarantee 100% accuracy due to the lack of normalization within the filings.
Health Insurance Brokers
Using data from the most recent Form 5500 filings, MFA found brokers and agents received more than $2.9 billion in fees and commissions for assisting with sales of various health and welfare benefit products inclusive of health, HMO, and PPO contracts. Twenty-two percent of all broker compensation was for business in the state of California. Business in the states of Texas and New York also ranked high in the lineup, with each state accounting for 8% of the total reported fees and commissions reported. Brokers in the state of Florida represent 6% of all reported fees. Additional insights about broker compensation may be researched by agency, insurer group, and employer contract.
|
Broker Commissions and Fees (Health, HMO & PPO contracts) |
||
|
Commissions |
Fees |
Total |
|
$2.231 Billion |
$735 Million |
$2.966 Billion |
Source: Mark Farrah Associates' 5500 Employer Health Plus |
||
About 5500 Employer Health Plus
The data used in this analysis brief was obtained from Mark Farrah Associates' 5500 Employer Health Plus. This new tool has been designed to simplify the analysis of employer health & welfare benefits including medical, dental, vision, disability, and other benefits. MFA’s 5500 Employer Health Plus uniquely focuses on health & ancillary benefits purchased by private sector employers and the relationships employers have with contracted insurers, administrators, and brokers. The user interface allows for both detailed and summary level data retrieval. Data sources includes Form 5500 filings and related schedules for plans that have the indication of providing health & welfare benefits.
About Mark Farrah Associates (MFA)
Mark Farrah Associates (MFA) is a leading data aggregator and publisher providing health plan market data and analysis tools for the healthcare industry. Our product portfolio includes Health Coverage Portal™, County Health Coverage™, 5500 Employer Health Plus, Medicare Business Online™, Medicare Benefits Analyzer™, and Health Plans USA™. For more information about these products, refer to the informational videos and brochures available under the Our Products section of the website or call 724-338-4100.
Healthcare Business Strategy is a FREE monthly brief that presents analysis of important issues and developments affecting healthcare business today. If you would like to be added to our email distribution list, please submit your email to the "Subscribe to MFA Briefs" section at the bottom of this page.
[1] The Employee Retirement Income Security Act of 1974 (ERISA) is a federal law that sets minimum standards for most voluntarily established retirement and health plans in private industry to provide protection for individuals in these plans. Entities such as churches and state, city, and local governments are generally not subject to ERISA.
[2] Employers generally use Schedule A to report information about insurance carriers and benefit plans, including premium amounts and broker/agent commission details for insured plans. Although benefit contract types are indicated within Schedule A, the premium amounts are not reported separately (e.g., health, dental, vision, disability).
[3] Information about benefit plans that are self-insured is generally reported in Schedule C. In many cases, the contracted carrier or TPA (third party administrator) generates this information for the employer. Schedule C provides details on fees associated with self-funded plans that exceed $5,000. Service provider fees are reported separately for direct compensation and indirect compensation arrangements.