Year-End Trends in Health Insurance Enrollment and Segment Performance
April 27, 2018
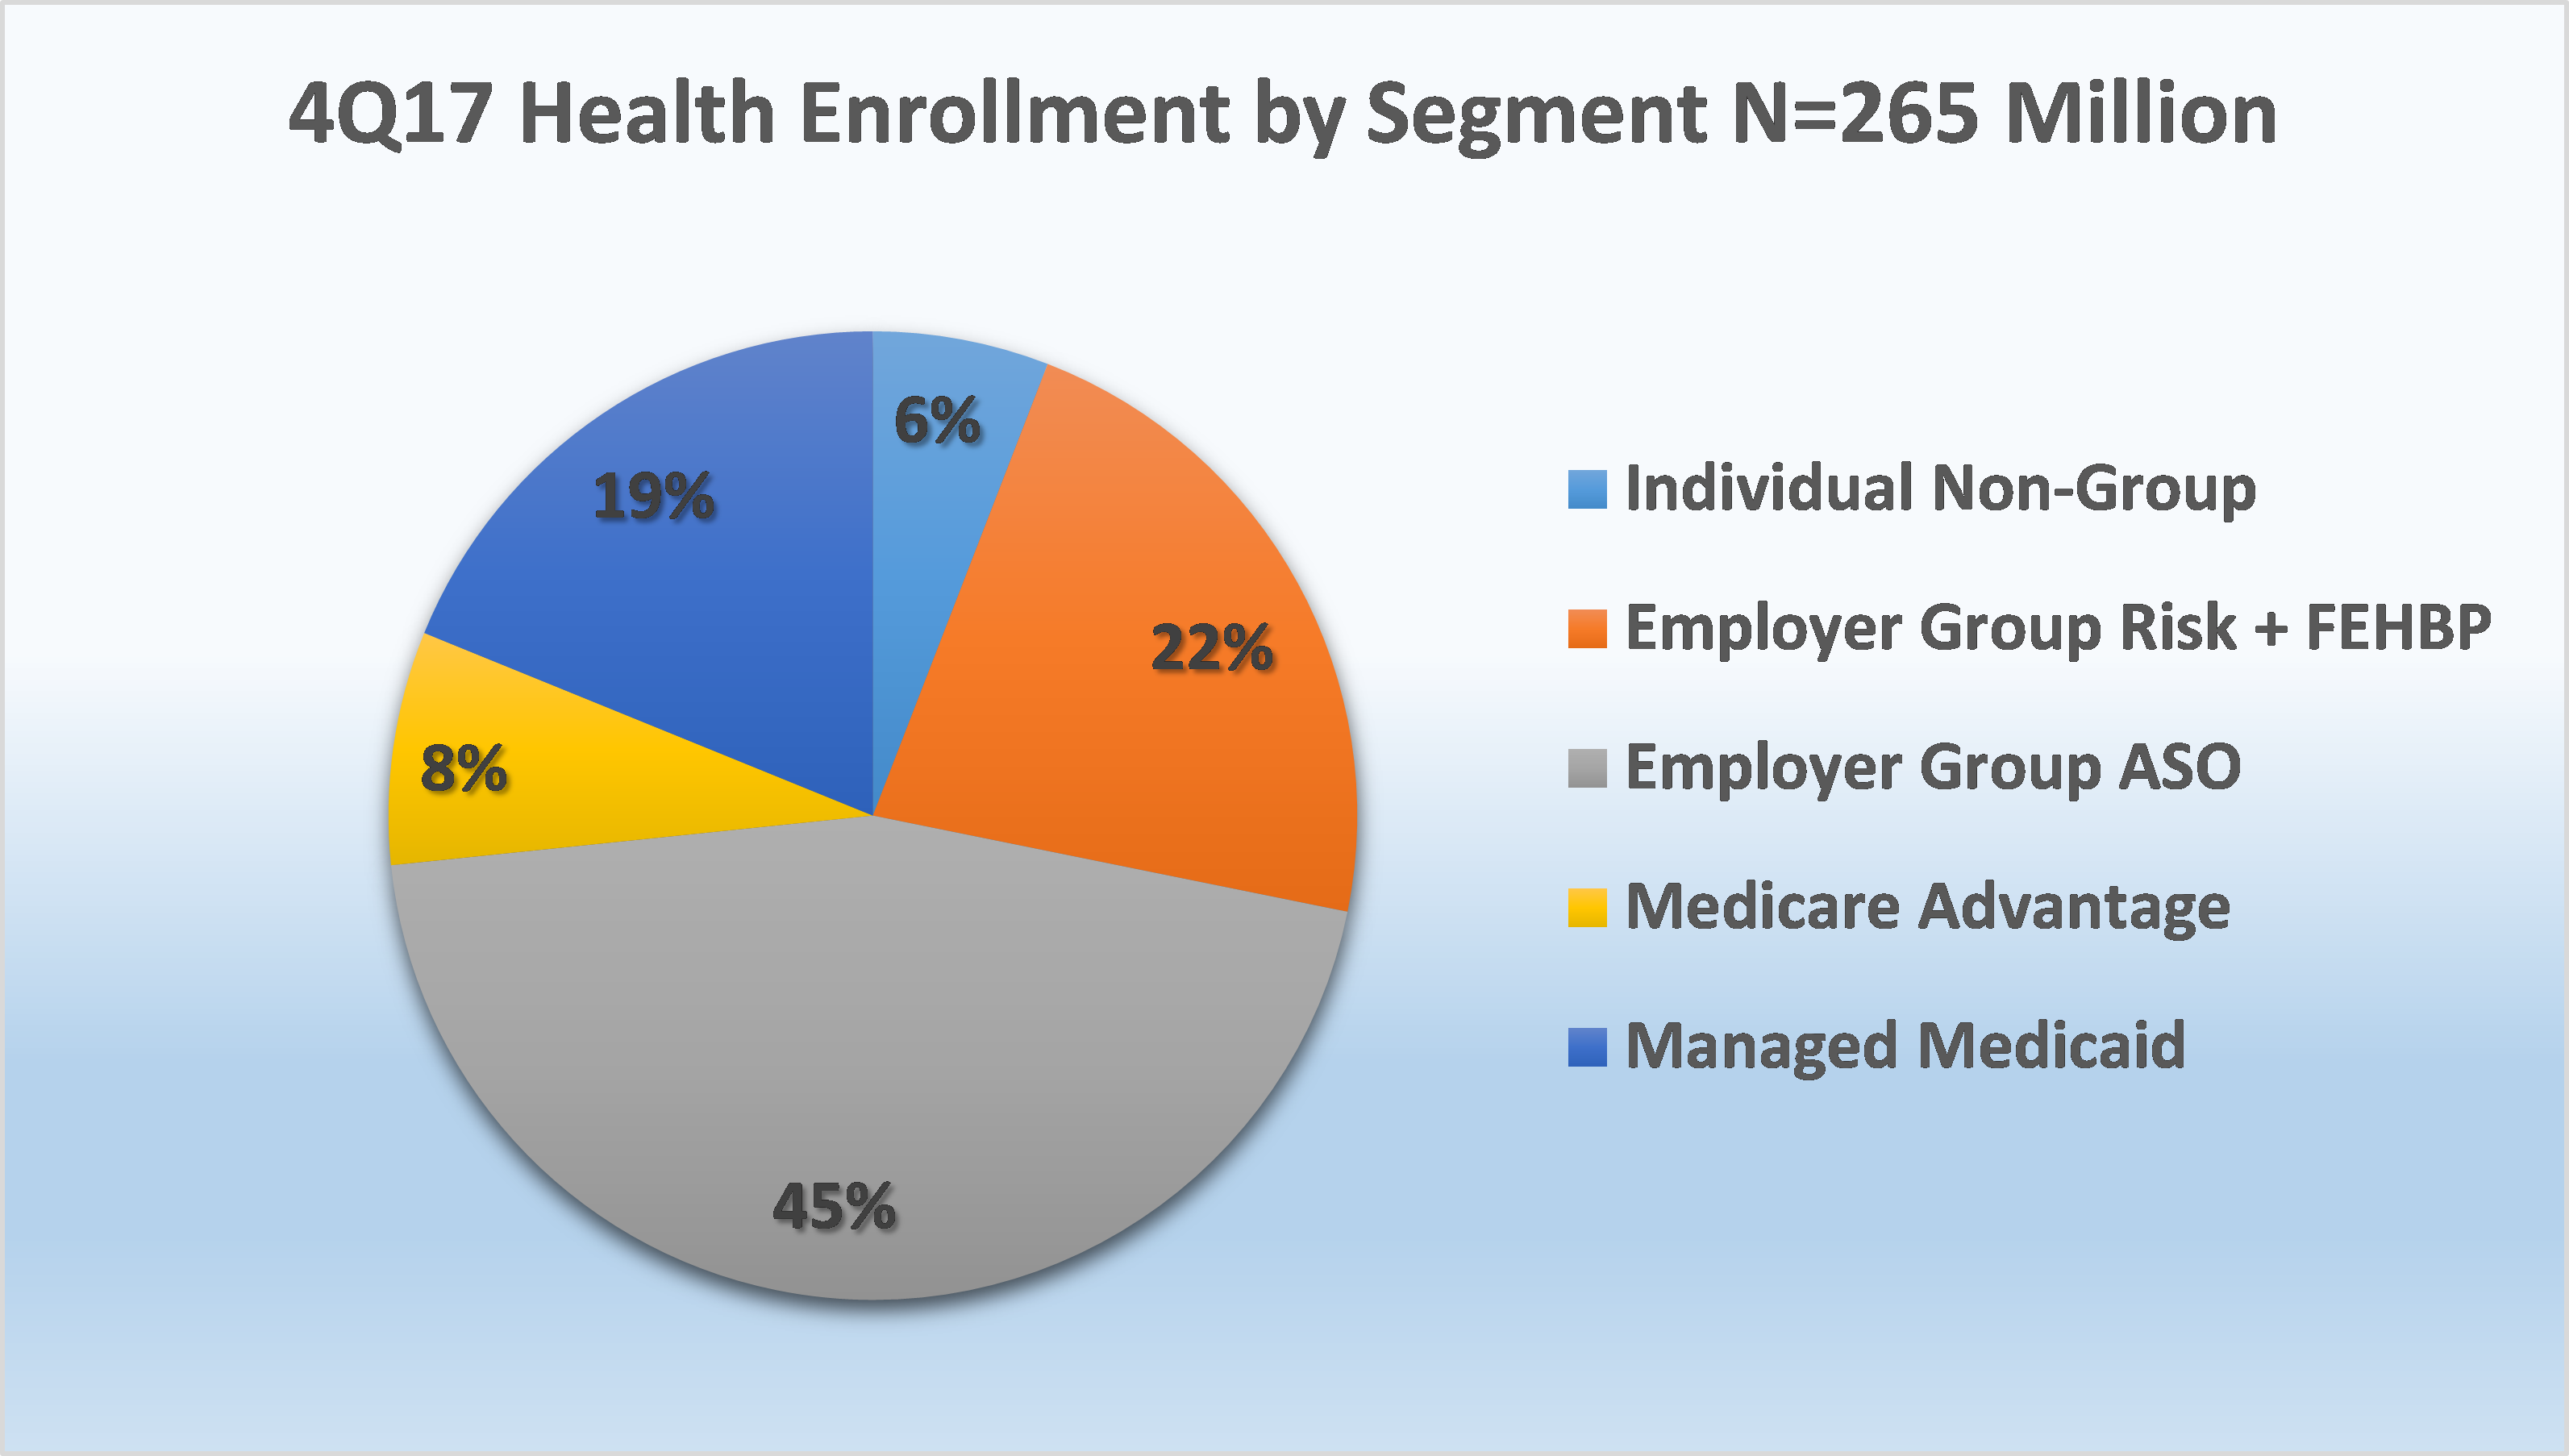
Mark Farrah Associates (MFA) assessed the latest year-over-year enrollment trends, comparing fourth quarter 2016 with fourth quarter 2017 segment membership based on data filed in statutory financial reports from the NAIC (National Association of Insurance Commissioners) and the CA DMHC (California Department of Managed Health Care). As of December 31, 2017, 265.2 million people received medical coverage from U.S. health insurers. This number is up from 264.3 million or approximately 929,000 members, from a year ago.
Year-end enrollment trends indicate membership gains for Medicare Advantage (MA) and Managed Medicaid while the Individual, Non-Group and Employer Group Risk business continued to experience year-over-year declines. This analysis presents key findings from MFA’s review of the latest year-over-year enrollment trends and segment performances.
Segment by Segment Enrollment Trends
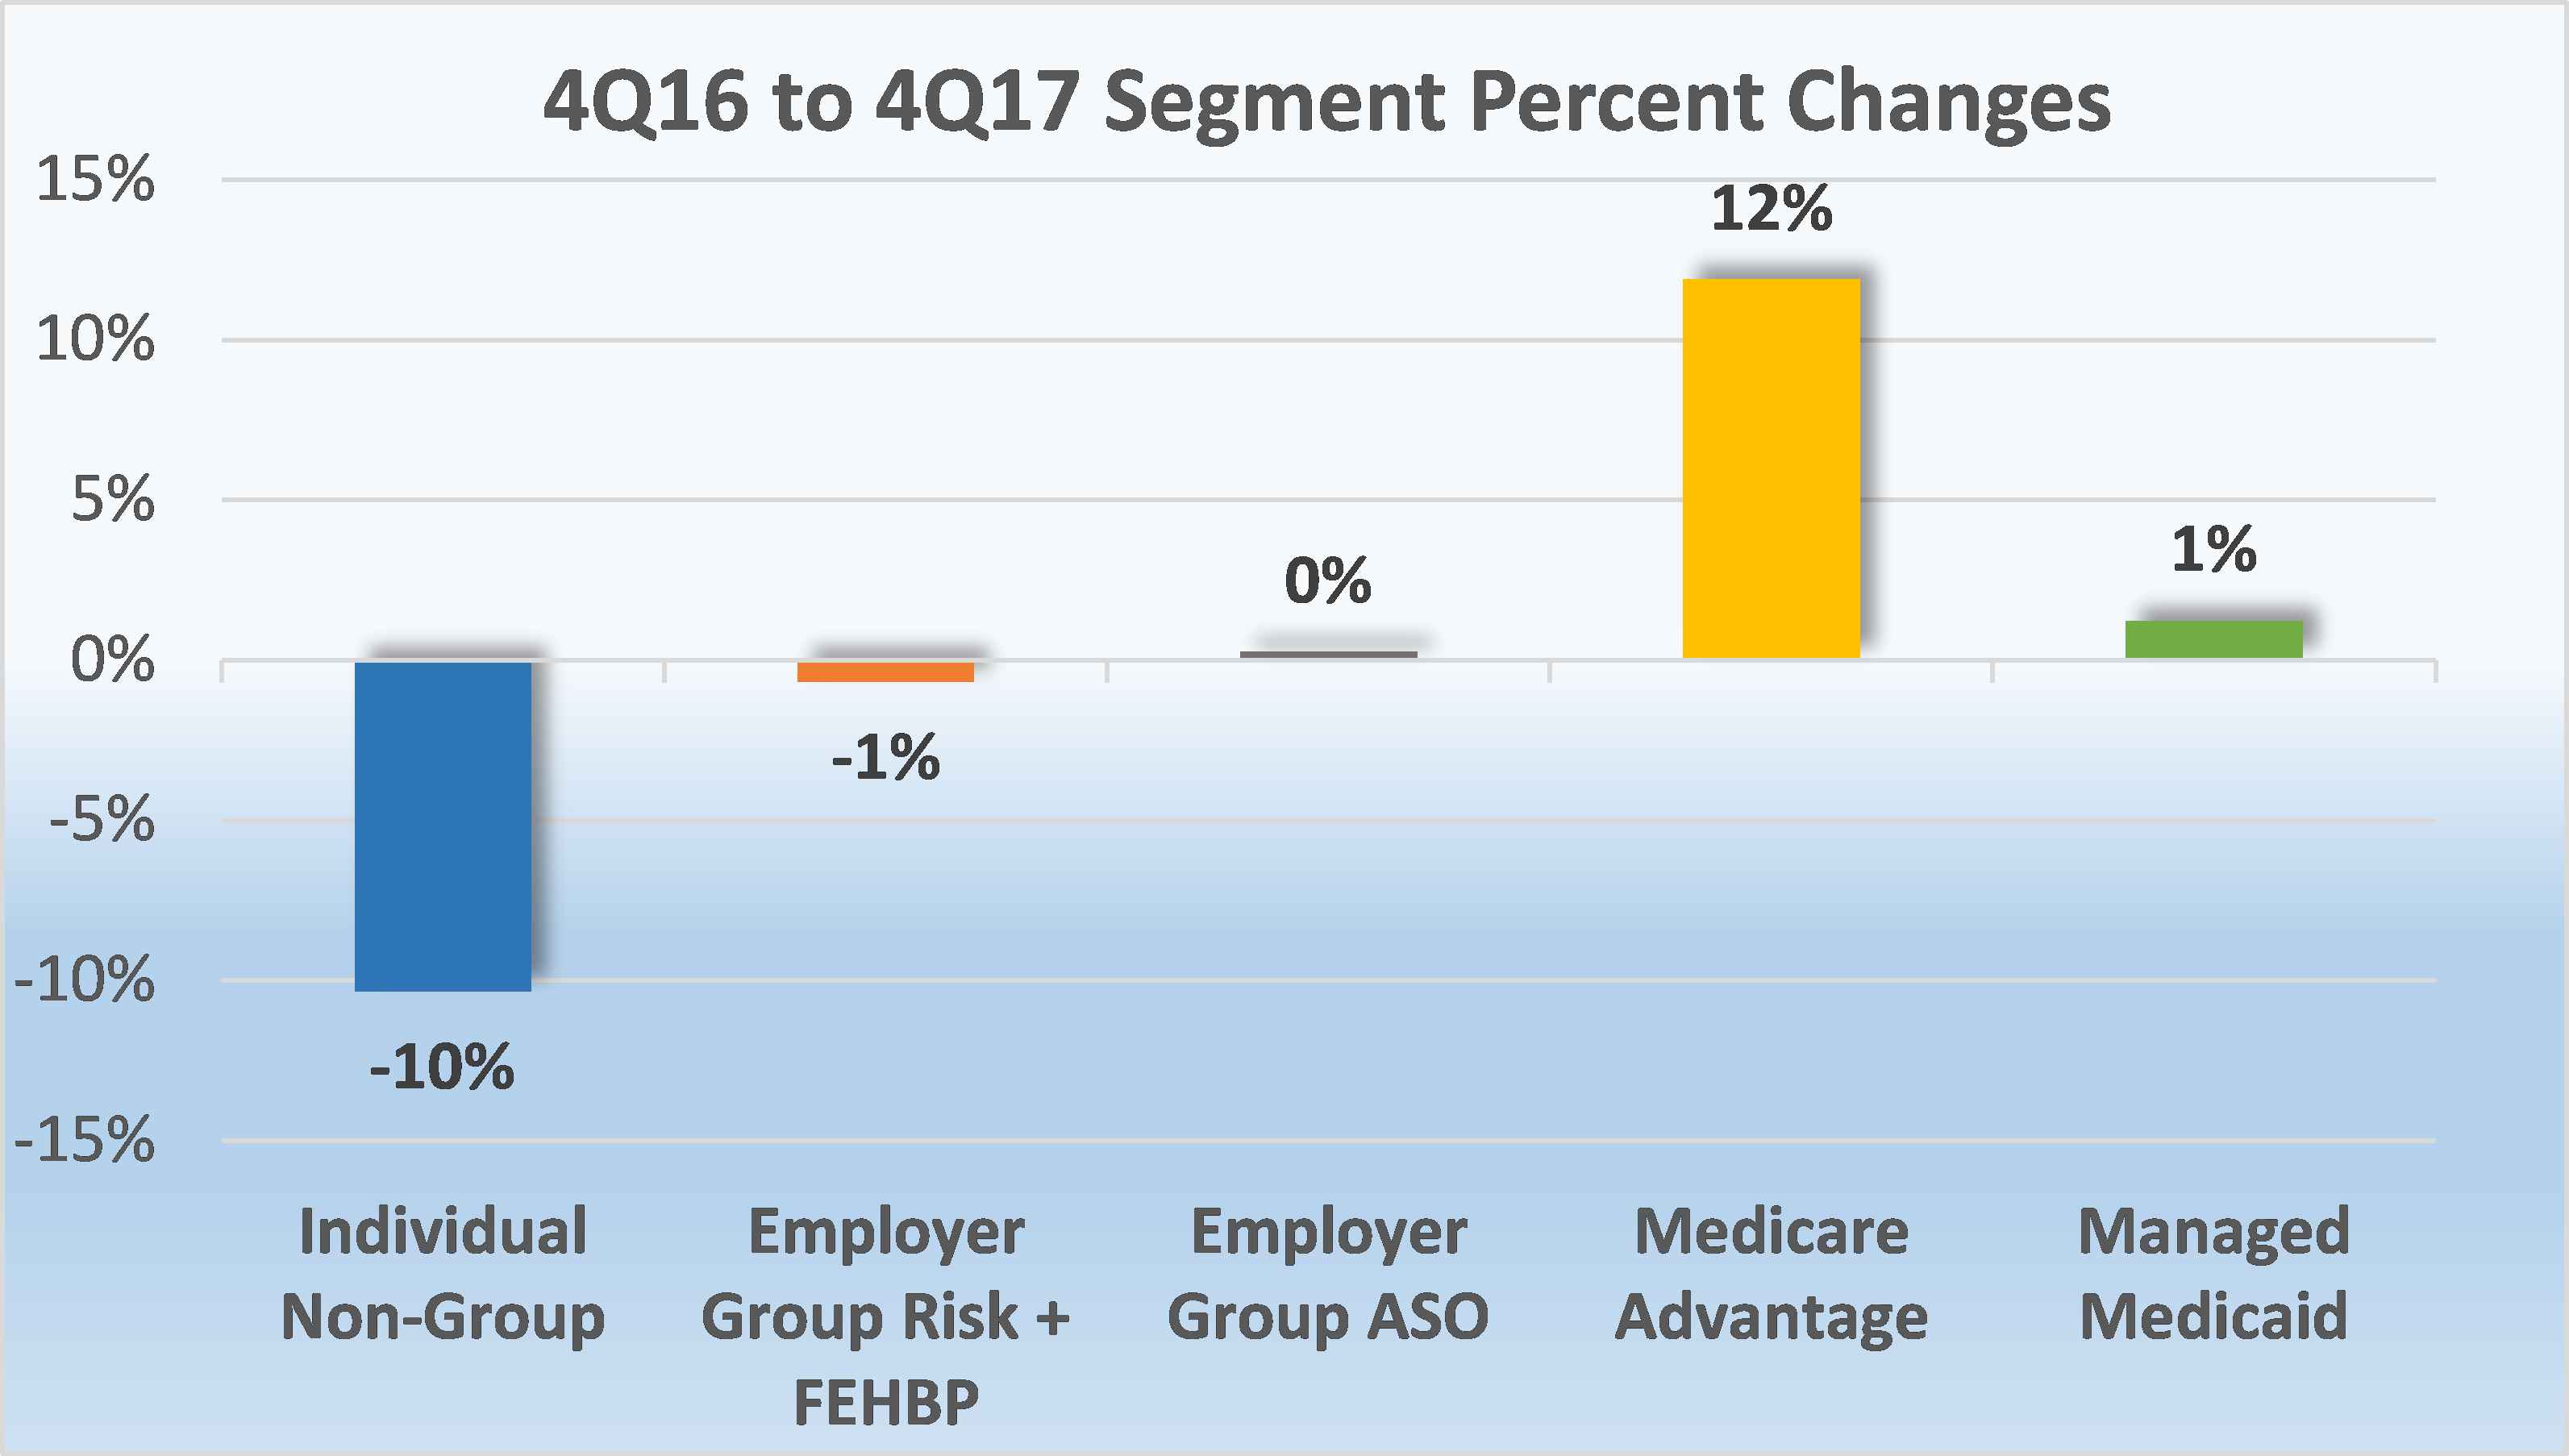
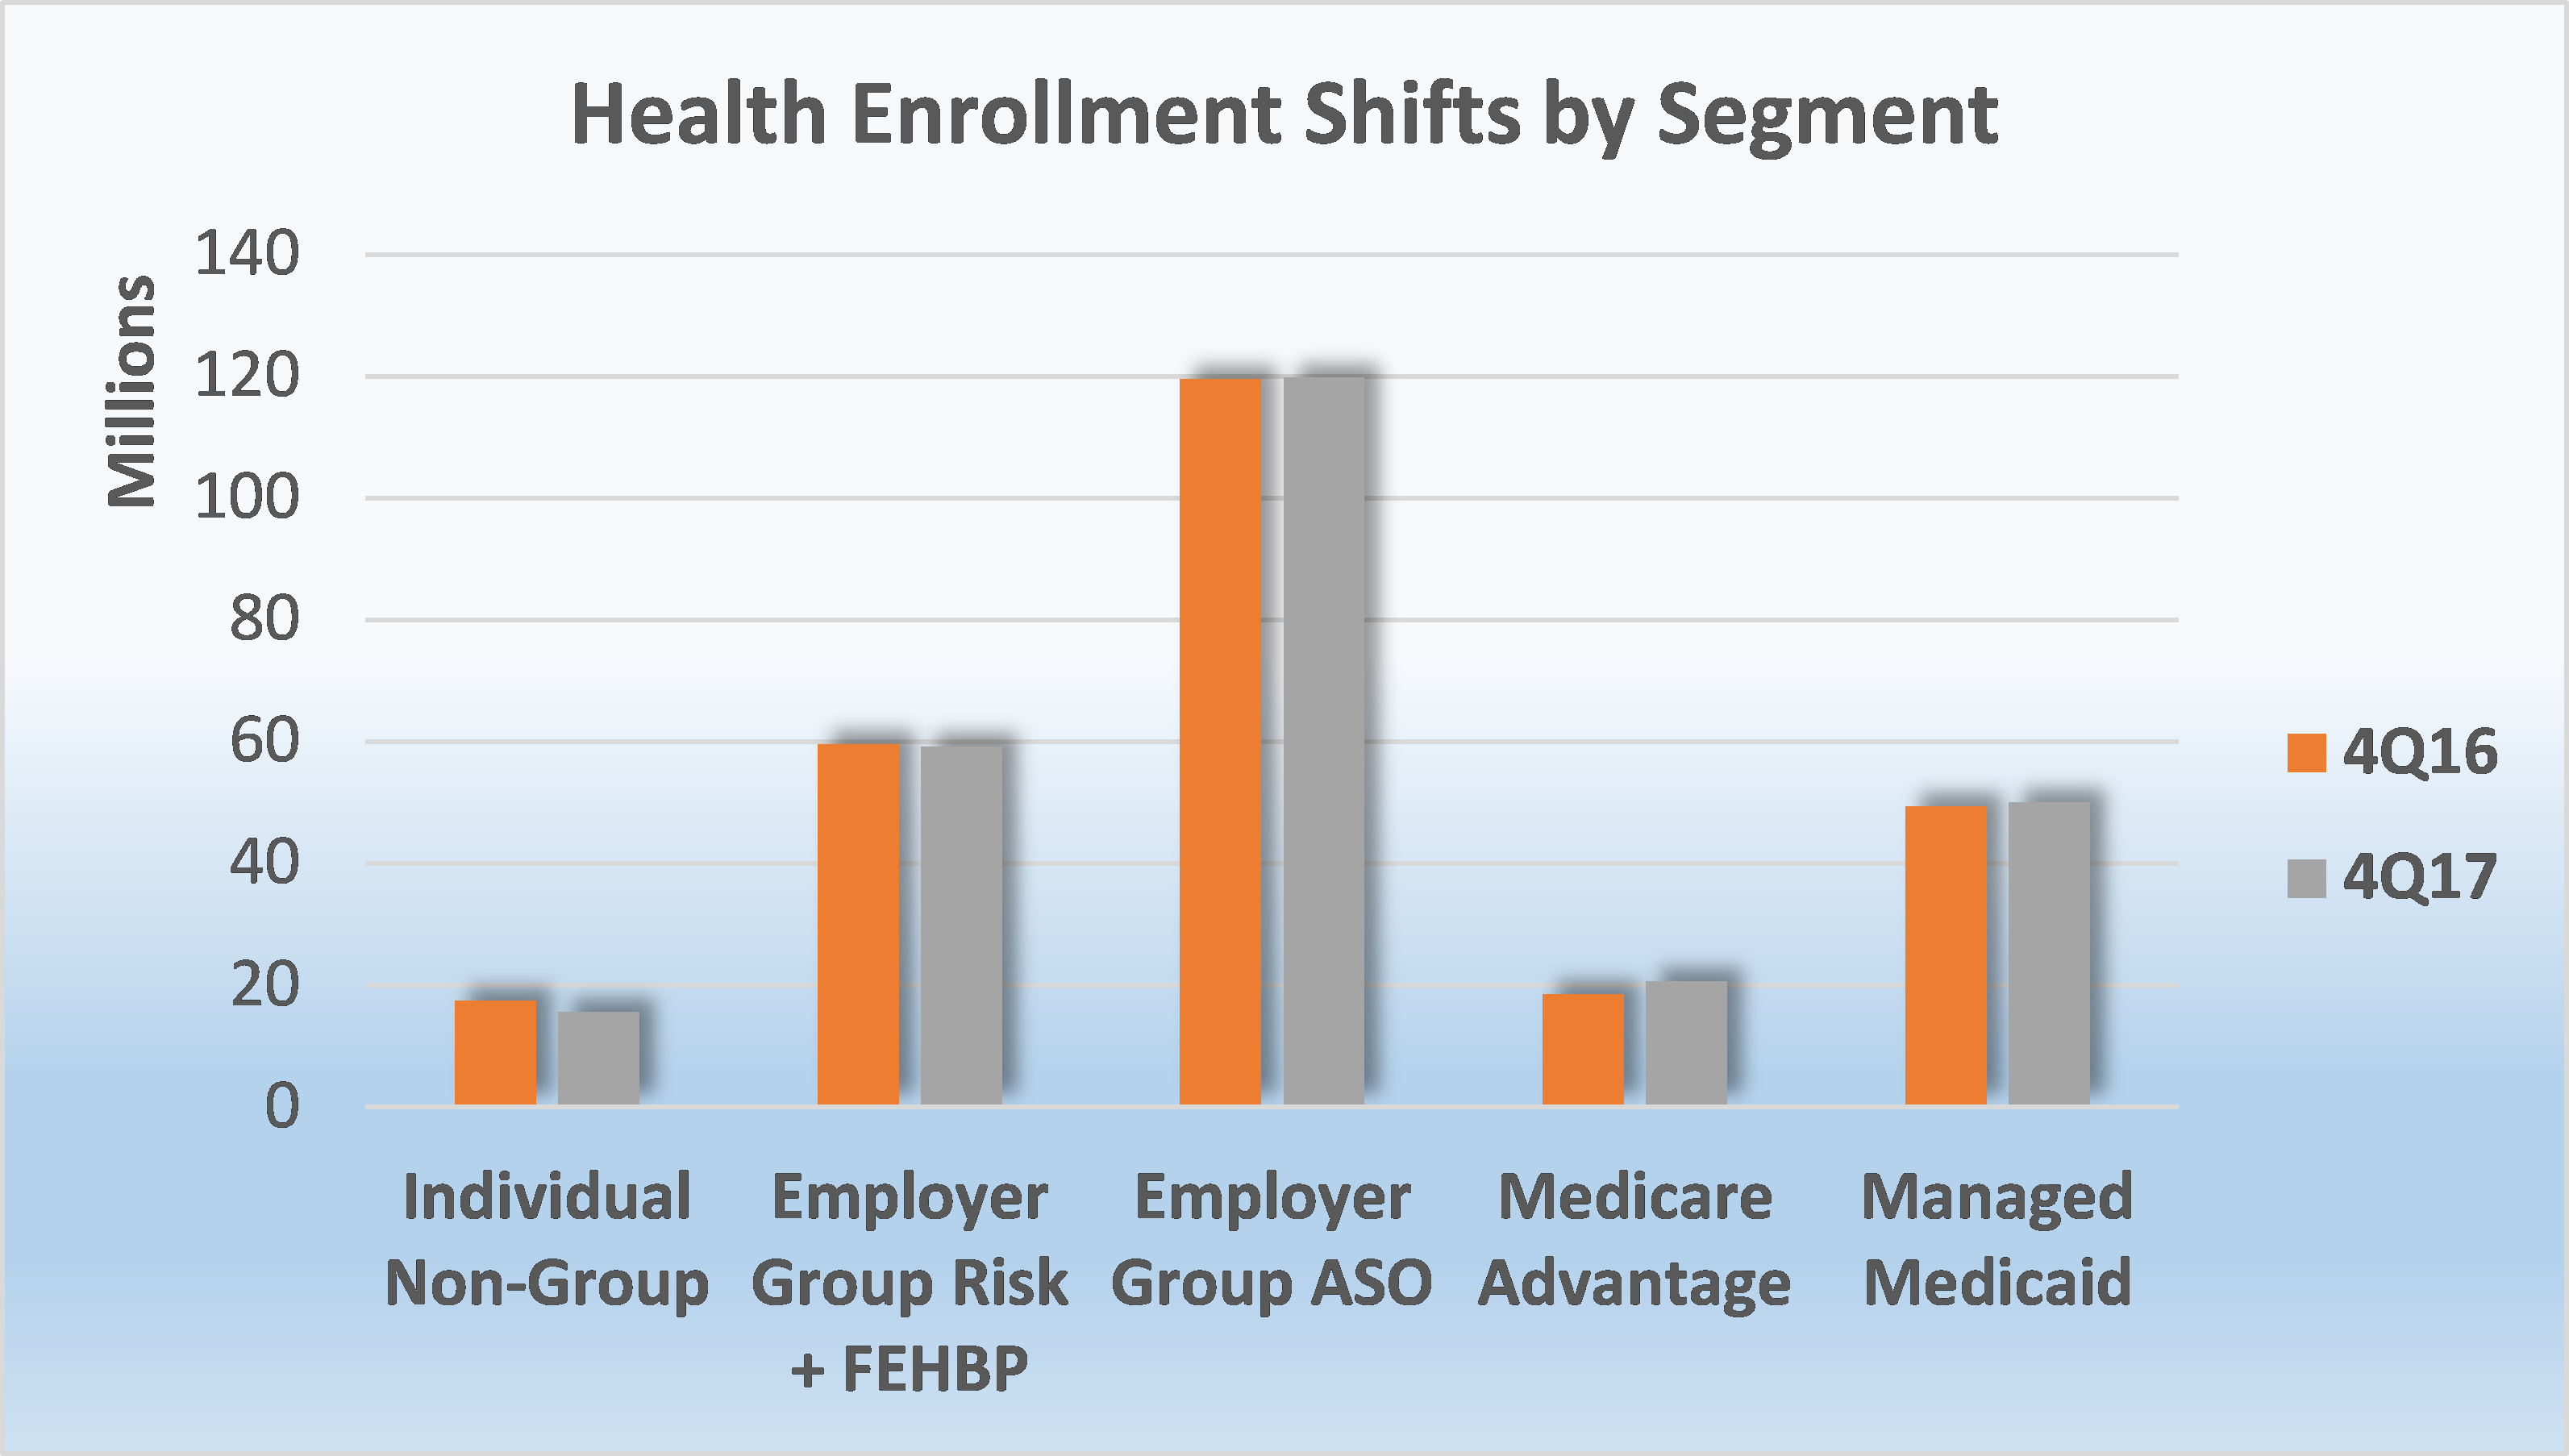
As of December 31, 2017, the Employer Group ASO (administrative services only for self-funded plans) business continued to be the largest source of coverage in the industry collectively enrolling 119.8 million people, although membership in this segment remained relatively flat between 2016 and 2017. From 4Q16 to 4Q17, Medicare Advantage experienced the most sizeable membership increase as 2.2 million more seniors chose an MA plan. Managed Medicaid also saw growth, albeit a slight increase, with only 614,000 new members who joined state-subsidized plans, year-over-year. This is in stark contrast to the increase of the 3.3 million Medicaid beneficiaries between 2015 and 2016. Countering enrollment increases within Government programs, the Individual, Non-Group segment lost nearly 1.8 million members and the Employer Group Risk segment, including the Federal Employees Health Benefit Plans (FEHBP) business, experienced a decline of approximately 402,000 members.
- MFA’s assessment of Individual, Non-Group medical plans found aggregate year-over-year enrollment, both on and off the exchange, experienced a significant decline of 10% from 17.3 million in December of 2016 to 15.6 million in December of 2017. Membership in 2017 has fallen almost 14% below the 2015 segment peak of 17.9 million members and is now solidly below the 16.9 million mark set in December of 2014.
With average healthcare premiums more than doubling since the onset of the Affordable Care Act (ACA) and health plans exiting the federal health insurance exchanges resulting in fewer healthcare choices for Americans, efforts to fix the Individual market continue. On April 9, 2018, the Centers for Medicaid and Medicare Services (CMS) issued the final 2019 Departments of Health and Human Services (HHS) Notice of Benefit and Payment Parameters. This final rule is among many attempts by Congress and the administration to help regulate the Individual health insurance market, enhance healthcare choices and control costs. According to CMS, key objectives of the 2019 Payment Notice Rule include: Increase flexibility, improve affordability, strengthen program integrity, empower consumers, promote stability, and reduce regulatory burden. The Market Stabilization rule, issued last year, and the recent proposed rule to expand the availability of short-term, limited-duration health insurance are examples of other initiatives to promote stability in the market.
Source: Health Coverage Portal TM, Mark Farrah Associates
- Year over year, Managed Medicaid membership marginally increased by 1%, or 614,000 enrollees. This was significantly down from the 7% growth in the prior year’s annual comparisons. Approximately 50 million Medicaid beneficiaries receive healthcare through Managed Care Organizations (MCOs), but it’s important to note that some plans submit special performance reports to the state and are not required to file NAIC statutory financial statements or the CA DMHC. According to the Centers for Medicare & Medicaid Services (CMS), nearly 74.04 million individuals were enrolled in Medicaid and the Children’s Health Insurance Program (CHIP) as of January 2018.
Medicaid continues to be the largest health program in the United States as measured by enrollment. It is also the largest budget expenditure for state governments. As states continue to contend with Medicaid budget constraints and rising medical costs, considerable changes to state Medicaid programs are inevitable.As of April 2018, 33 states including the District of Columbia have chosen to expand their Medicaid programs under the ACA, with Maine being the latest to adopt expansion through a ballot initiative in November 2017.
Of the 18 states that have not expanded, some are considering Medicaid expansion including Utah, Idaho, Virginia and Nebraska. Additionally, some states are considering transitioning beneficiaries from a fee-for service model to managed-care plans. North Carolina is a recent example. After much deliberation among state lawmakers around the decision to expand Medicaid, the state has opted not to expand. However, in an attempt to reform its Medicaid program, North Carolina Medicaid and NC Health Choice programs have made the decision to move to a managed care delivery system pending federal approval, for a projected start date of July 1, 2019.
- Medicare Advantage (MA) enrollment continued to demonstrate steady growth year-over-year. Approximately 34% of the 61 million people eligible for Medicare are enrolled in MA plans across the United States and U.S. territories. Membership in Medicare Advantage (MA) plans increased from 18.4 million as of December 31, 2016 to 20.6 million at year-end 2017 according to plan-reported statutory reports.
With continued efforts to regulate policies and provide more flexibility for MA and PDP programs, CMS issued final updates to the Medicare Advantage and Part D Prescription Drug programs for 2019 in its Final Rule on April 2, 2018. Some major provisions for CY 2019 include changes to benefit uniformity requirements, marketing rules and the star rating process. A summary of the key provisions can be reviewed here. In addition, a 3.4% on average rate increase is expected for Medicare Advantage and Part D plans in 2019, which contrarily is a significant increase from the 1.84% percent rate increase that was proposed in the February Advanced Notice and Draft Call Letter.
Source: Health Coverage Portal TM, Mark Farrah Associates
- Employer Groups continue to be a dominant source of health coverage in the U.S. The latest figures show Employer Group Risk membership, including Federal Employees Health Benefit Plans (FEHBP) membership, experienced a 1% decline between 4Q16 and 4Q17. Year-over-year membership for this segment decreased by 402,000 as more employers continue to shift towards self-funded (ASO) insurance for their employees.
- According to MFA’s recent estimates, employer group ASO (administrative services only for self-funded business) membership grew by over 319,000 members from December 2016 to December 2017. MFA identified 119.8 million ASO covered lives, which encompassed 45% of total health enrollment by segment for 4Q17.
Source: Health Coverage Portal TM, Mark Farrah Associates
The data used in this analysis brief was obtained from Mark Farrah Associates' Health Coverage Portal™ database. It is important to note that MFA estimated fourth quarter 2017 enrollment for a small number of health plans that are required to report quarterly enrollment but hadn’t yet filed. Employer group ASO figures may be estimated by Mark Farrah Associates using credible company and industry resources. Individual, Non-Group membership reported by some carriers may include CHIP (Children’s Health Insurance Program).
These adjustments may have resulted in moderate understatement or overstatement of enrollment changes by segment. Findings reflect enrollment reported by carriers with business in the U.S. and U.S. territories. Data sources include NAIC (National Association of Insurance Commissioners) and the CA DMHC (California Department of Managed Health Care). As always, MFA will continue to report on important plan performance and competitive shifts across all segments.
About Mark Farrah Associates (MFA)
Mark Farrah Associates (MFA) is a leading data aggregator and publisher providing health plan market data and analysis tools for the healthcare industry. Our product portfolio includes Health Coverage Portal™, County Health Coverage™, Medicare Business Online™, Medicare Benefits Analyzer™, and Health Plans USA™. For more information about these products, refer to the product videos and brochures available in the products section of our website or call 724-338-4100.
Healthcare Business Strategy is a free monthly brief that presents analysis of important issues and developments affecting healthcare business today. If you would like to be added to our email distribution list, please submit your email to the "Subscribe to MFA Briefs" section in the grey area at the bottom of the page.
Request Information
within 1-2 business days.